Quantum Technology Companies: patent analysis - part III
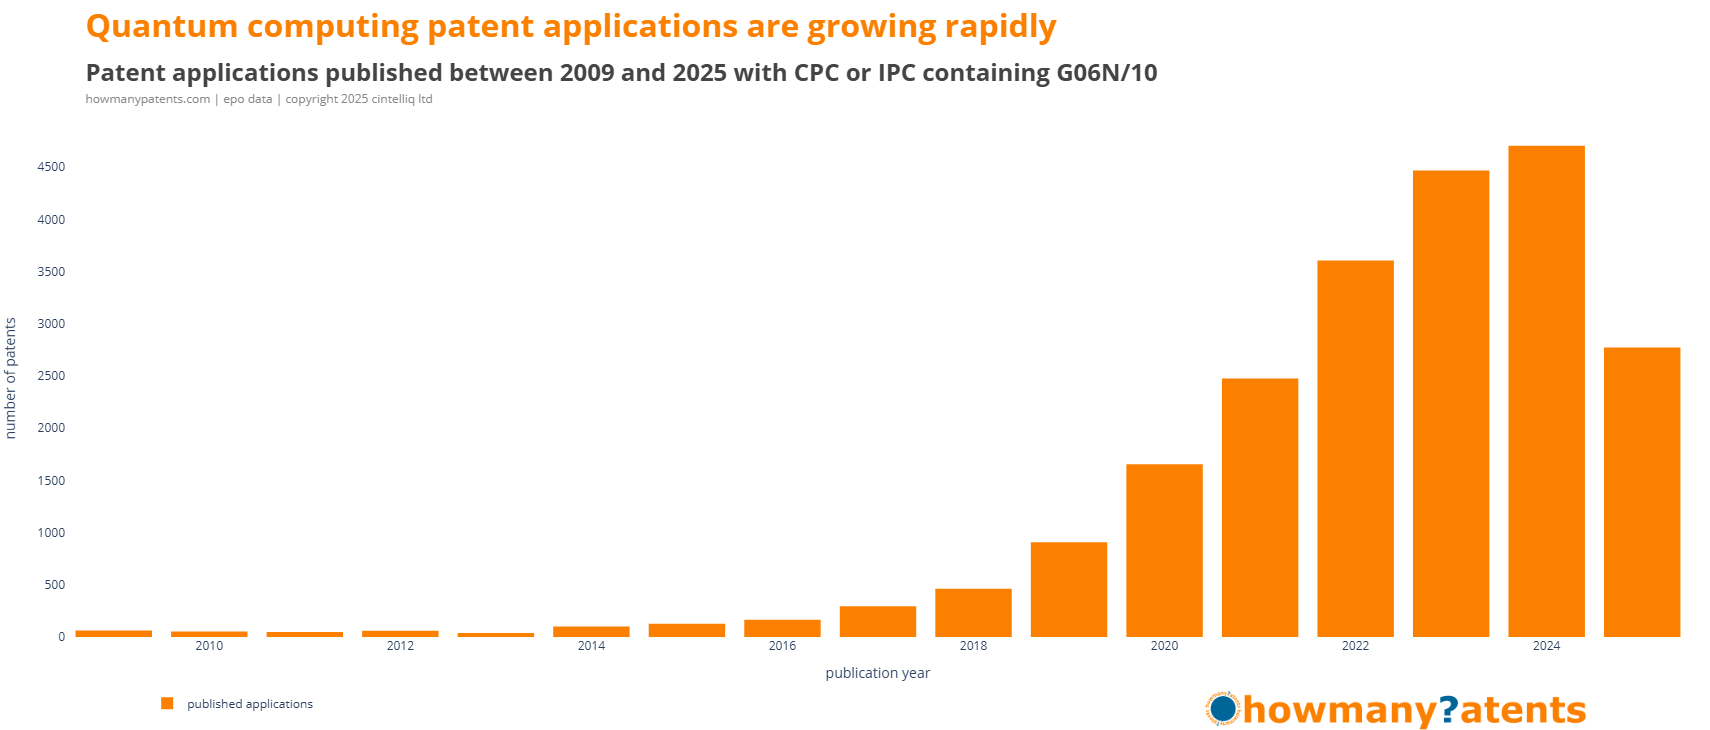
Background: Quantum computing patent applications have increased significantly since 2009, reflecting the growing maturity and industrial relevance of the field.
Patent intelligence for people who don't read patents
However, for those without a background in patents, or the means to access patent analytics, it’s not always clear what this growth in patents means for strategy, innovation, or competition.
To address this we are publishing the Quantum Technology Companies: Patent Report 2025. The report will be available at the end of September 2025.
The report aims to translate complex patent data into clear, decision-useful insights—designed for people who don’t read patents but need to understand what they reveal.
So whether you're tracking competitors, exploring partnerships, or planning R&D strategy, this report offers practical patent intelligence without legal jargon or technical complexity.
Sharing insights as we progress
As our research progresses towards the release of the report I’ll be sharing selected findings from the research conducted so far for the Quantum Technology Companies: Patent Report 2025.
Previously, we looked at the overall progress of quantum patent applications.
See previous articles:
- Quantum Technology Companies: patent analysis - part I
- Quantum Technology Companies: patent analysis - part II
Applicant analysis
One of the challenges in patent analysis is that company names are not always consistent.
Some online research services provide a “normalised” or “standard” name for each company. In our case, we work with raw patent data from the EPO, which means there are often many different variations of the same company name.
Take D-Wave as an example. In the current quantum computing dataset, there are 60 different entries for D-Wave. Some are simple variations of the company name, while others list inventors alongside, and there may also be partnerships listed.
All of these variations need to be “mapped” to a single normalised name: D WAVE SYSTEMS INC, which has been selected as it appears on the majority of the company's patent applications.
Here is a selection D-Wave applicant names present in patent data from the EPO Docdb master file.
- D WAVE SYSTEMS INC - 468
- DWAVE SYS INC - 141
- D WAVE SYSTEMS INC | 1372934 B C LTD - 12
- DWAVE SYSTEMS INC - 9
and there are also many patent applications that include the names of inventors, such as
- DWAVE SYS INC | JOHANSSON JAN | BERKLEY ANDREW J
- JOHANSSON JAN | BERKLEY ANDREW J | DWAVE SYS INC
- BUNYK PAUL | NEUFELD RICHARD DAVID | MAIBAUM FELIX | DWAVE SYS INC
Having company name variations makes it harder to analyse D-Wave’s patents by count, as the variations prevent all entries from being grouped together and the result is an incorrect total.
In the current dataset there are over 3,000 distinct “company names.” Many of these appear only once. While a few may represent a genuine single-patent company, the vast majority are variations of the same companies that file most of the applications.
An initial review suggests there are about 440 unique applicants that together account for 80% of all applications and grants.
Normalising these names manually would take too much time, which is why the process has to be automated using software — and that is what we have done. Without this step, analysis of the leading companies in quantum computing would be inaccurate.
Our analysis is informational only, with no legal consequence, so we use the clearest and shortest company name possible to keep the results consistent and easy to read.
Quantum technology developers
Recall, in Quantum Technology Companies: patent analysis I discussed grouping applicants into one of four
Quantum-first companies
Companies that are founded specifically to develop quantum technologies — such as quantum hardware, software, or algorithms. Quantum computing is their core business and reason for existence.
- Examples: IonQ, Rigetti, PsiQuantum, Oxford Quantum Circuits
- Key traits: Born-quantum, deep tech R&D, often start-ups or spinouts
- Focus: Building quantum systems from the ground up, applying quantum to existing problems (e.g., optimisation, simulation, cryptography)
Commercial companies (nonquantum-first)
Companies whose core business was built on classical technologies, but are now adopting or investing in quantum computing for strategic purposes. Quantum is not their origin, but a new direction.
- Examples: Google, Microsoft, Siemens, JPMorgan Chase, Accenture
- Key traits: Classical roots, large-scale infrastructure, quantum is an extension
- Focus: Applying quantum to existing problems (e.g., optimisation, simulation, cryptography), building quantum systems from the ground up
Academic Institutions
Organisations primarily focused on education and fundamental research. They play a critical role in advancing quantum science, often producing early-stage innovations that later lead to patents, spinouts, or collaborations with industry. While not commercial entities, many contribute significantly to the quantum patent landscape.
- Examples: University of Cambridge, TU Delft, Yale University, MIT
- Key traits: Research-driven, non-commercial, publish-first culture, often source of spinouts
- Focus: Fundamental research, talent development, IP generation
Government Institutions/Agencies
Public bodies responsible for funding, coordinating, and sometimes directly conducting quantum research. They help set national agendas, provide infrastructure support, and maintain strategic oversight. Some institutions also operate government labs or hold patents, but their role is typically to enable — not commercialise — quantum development.
- Examples: DARPA, NIST, CSIRO, Dstl, Fraunhofer, IMEC
- Key traits: Policy-driven, non-commercial, long-term focus, national interest
- Focus: Funding, coordination, standards, and strategic national capability
We will classify every patent applicant as one of these four groups.
Forty organisations account for over half of all quantum computing patent applications
The analysis that follows is based on patent applications filed between 2009 and mid-2025. More specifically, it covers patent applications where there is only a single applicant named, resulting in 20,036 patent applications.
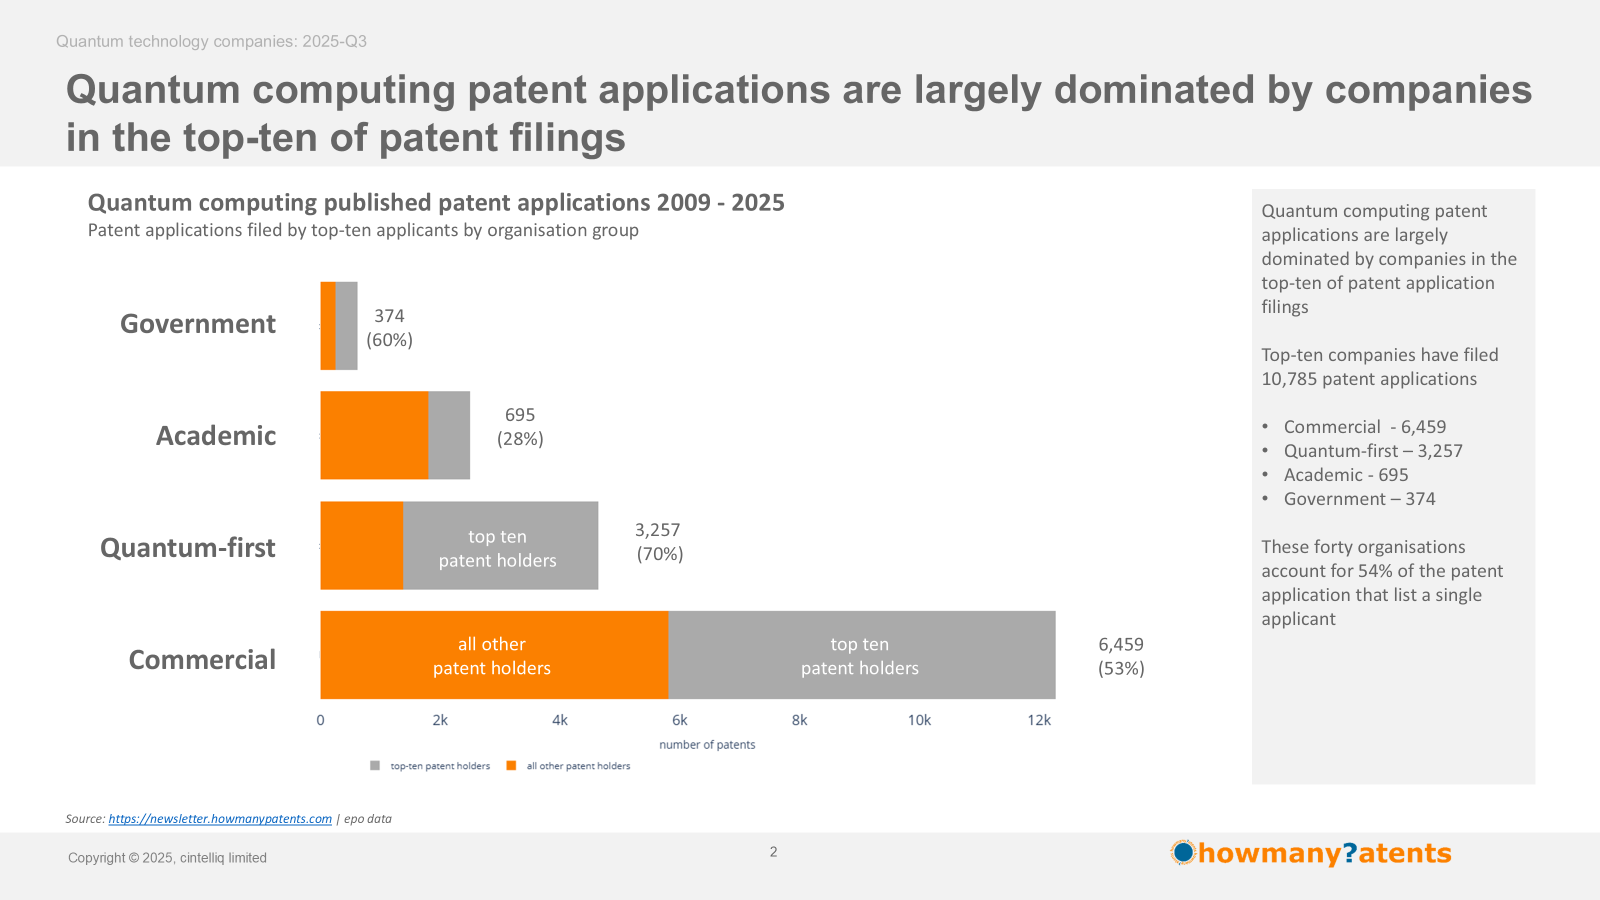
The top-ten organisations in each group (40 organisations in total) filed 10,785 applications (54% of 20,036).
Concentration by group:
- Commercial (non-quantum-first) - 53%
- Quantum-first - 70%
- Academic - 28%
- Government - 60%.
Within the companies category, just the top-ten companies alone represent 39% of patent applications overall - 7,873 / 20,036.
Top-ten companies overall
This analysis is a ranking of the organisations in terms of patent applications, without any regard to the "organisation" type.
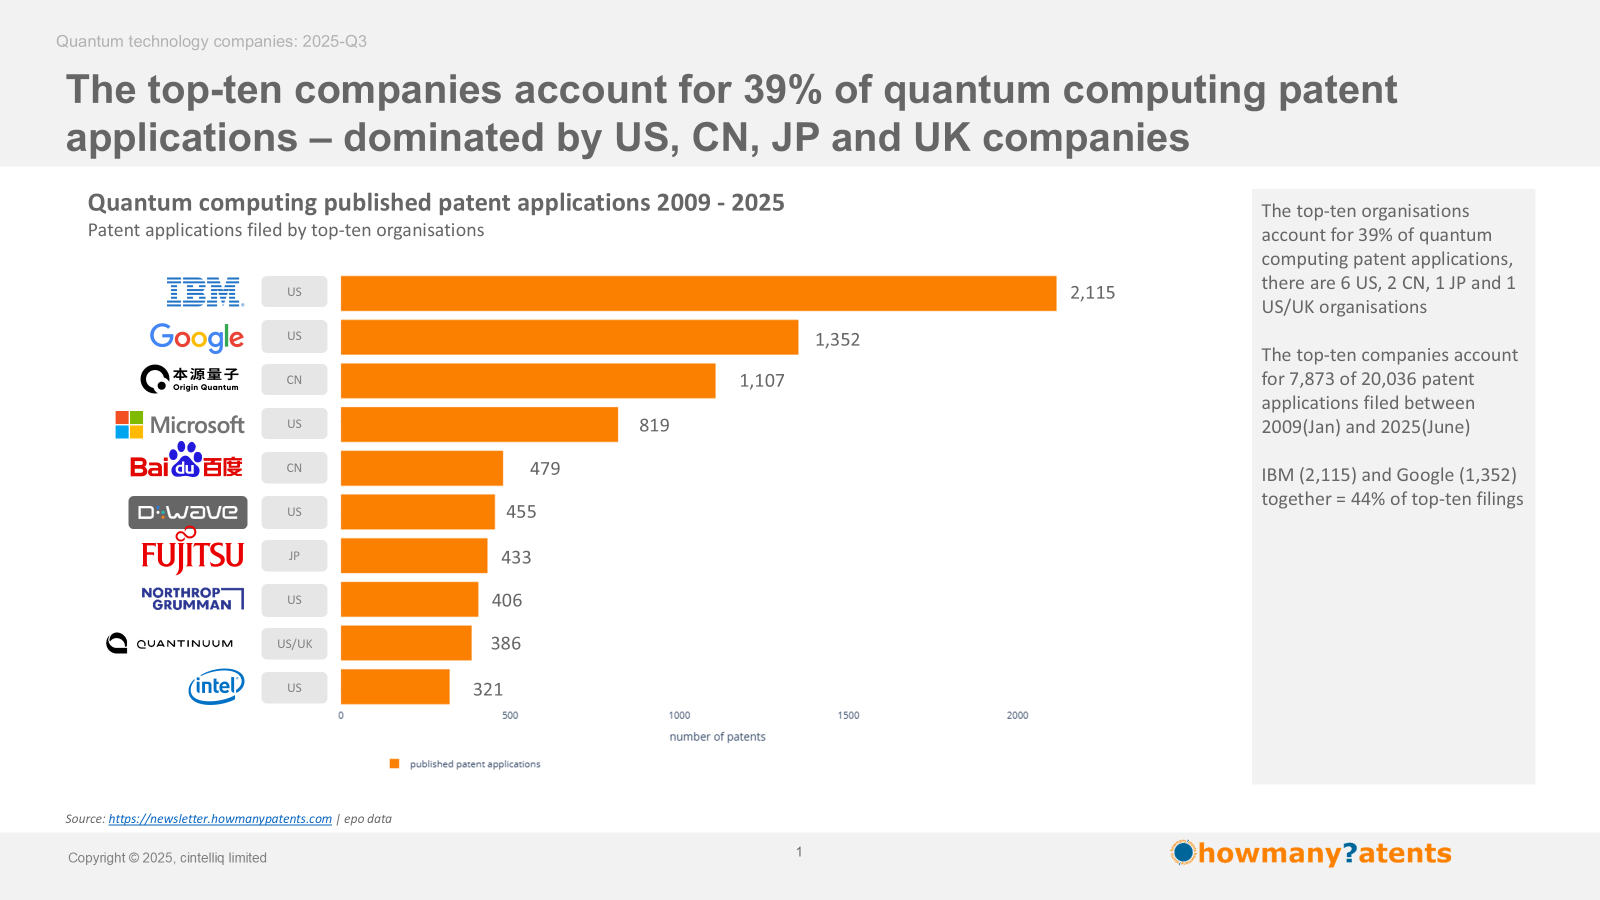
The top-ten companies account for 7,873 of 20,036 patent applications filed between January 2009 and June 2025. The top-ten organisations account for 39% of quantum computing patent applications.
There are 6 US organisations, 2 Chinese organisations, 1 Japanese, and 1 US/UK organisation.
Of the top-ten organisations, 7 are commercial (non-quantum-first) and 3 quantum-first organisations.
IBM (2,115) and Google (1,352) together account for 44% (3,467/7,873) of top-ten organisation filing patent applications.
Top-ten commercial (non-quantum-first) companies
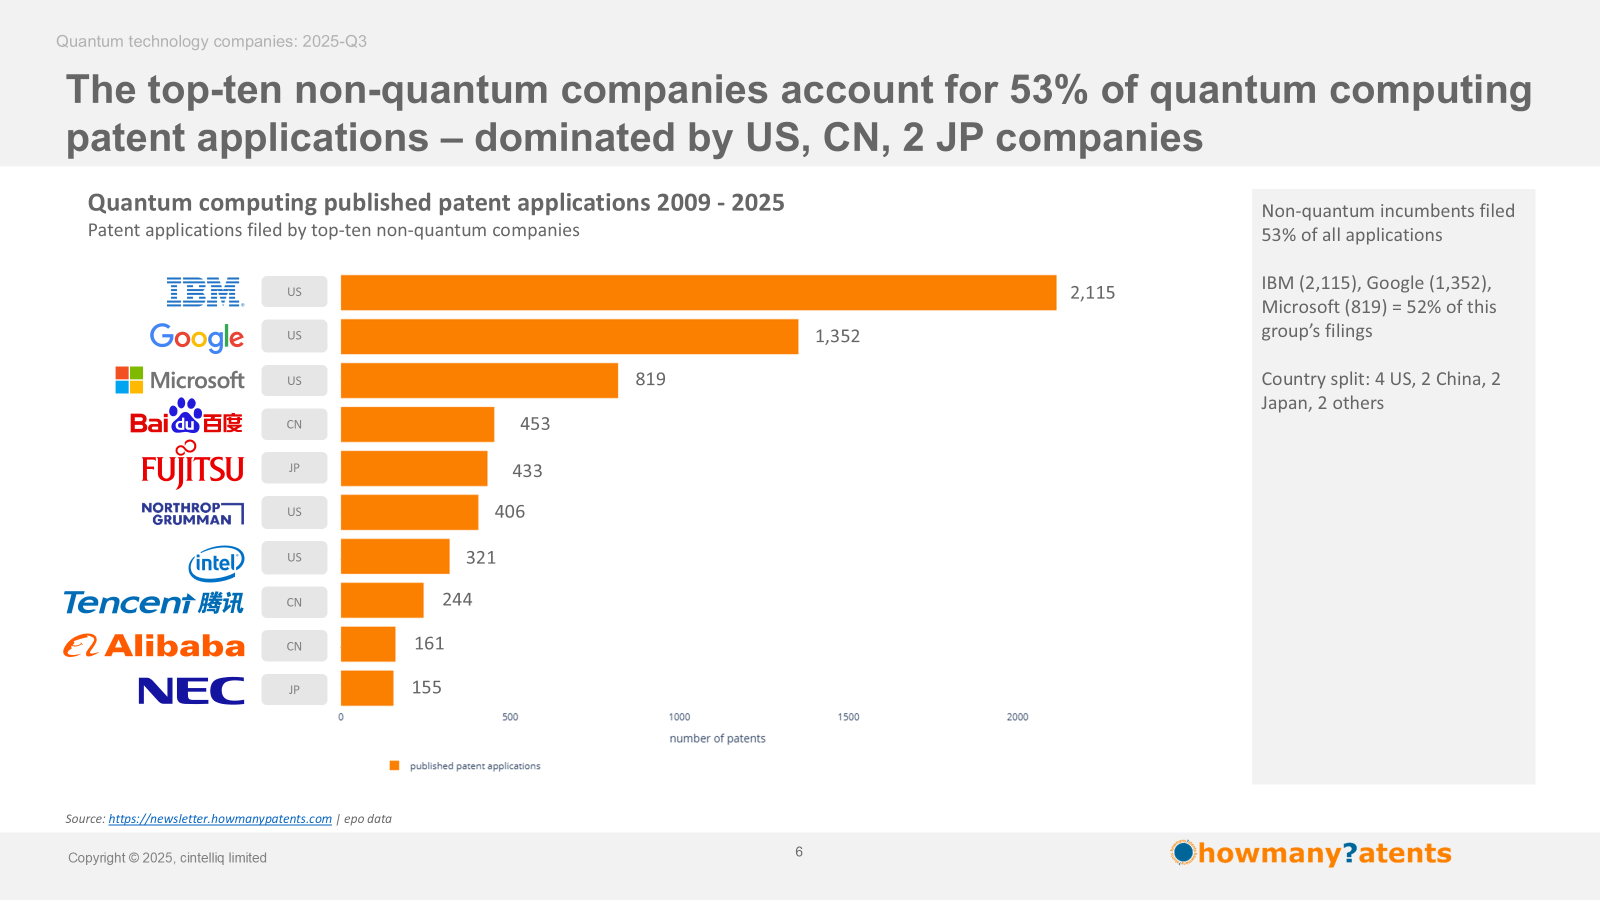
Commercial (non-quantum-first) companies filed 53% of all quantum computing patent applications.
IBM (2,115), Google (1,352), Microsoft (819) account for 52% of this group’s patent applications.
By country, there are 5 US companies, 3 Chinese companies, and 2 Japanese companies.
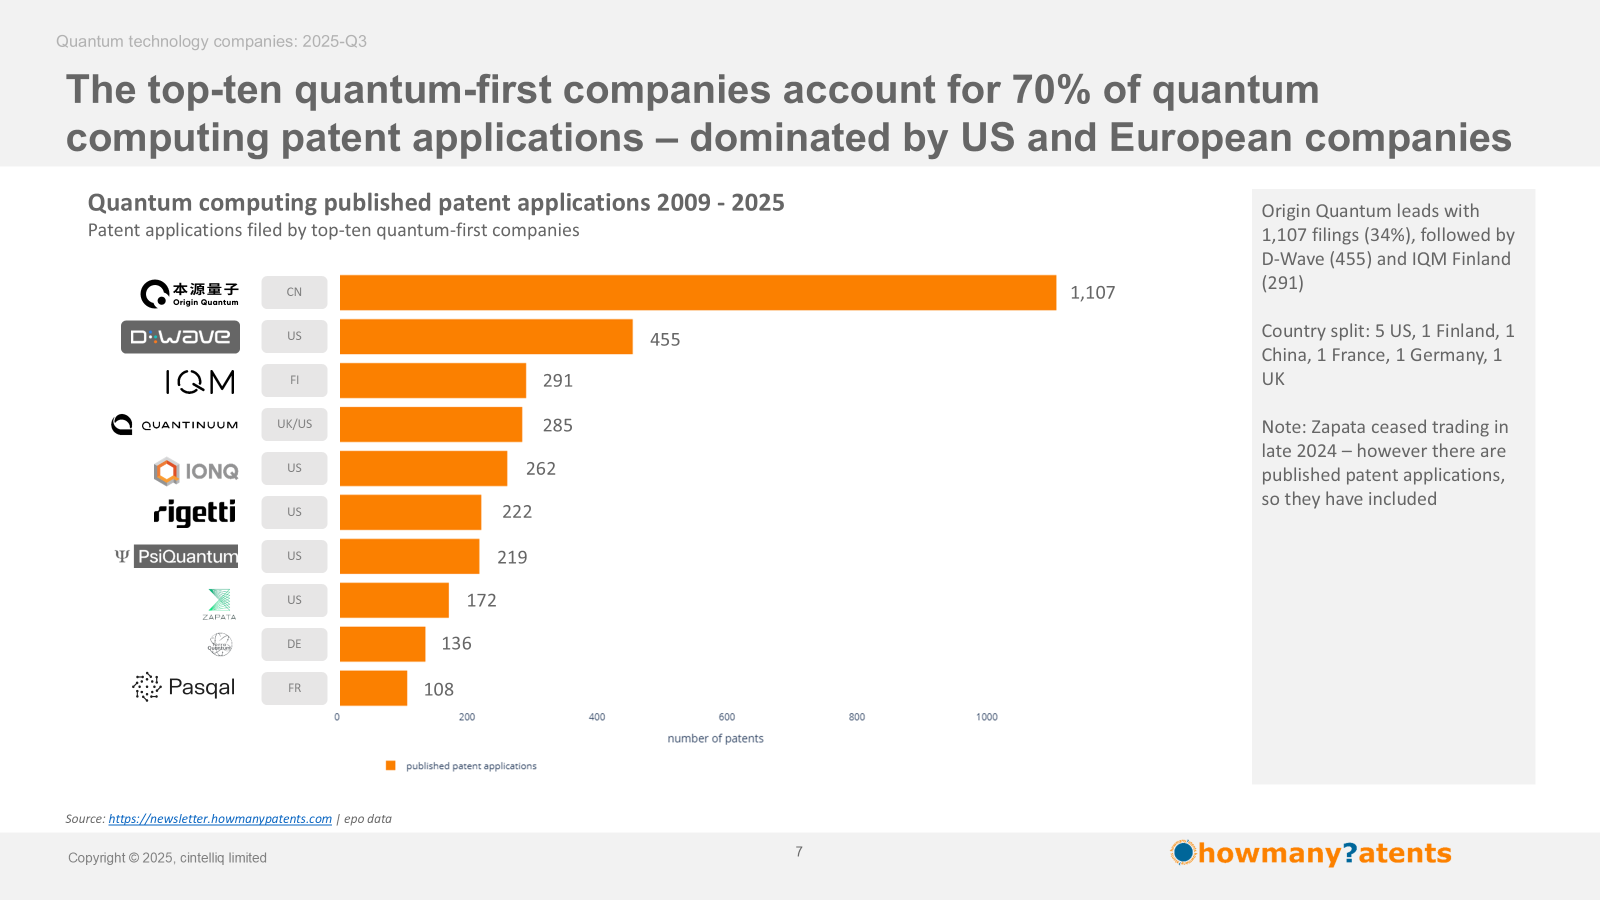
Top-ten quantum-first companies
The top-ten quantum-first companies account for 70% of quantum computing patent applications – dominated by US and European companies
Origin Quantum leads with 1,107 patent applications (34%), followed by D-Wave (455) and IQM Finland (291)
By country, there are 5 US, 1 Finish, 1 Chinese, 1 French, 1 Germany, and 1 UK quantum-first companies.
Note: Zapata ceased trading in late 2024 – however published applications remain, so they are included.
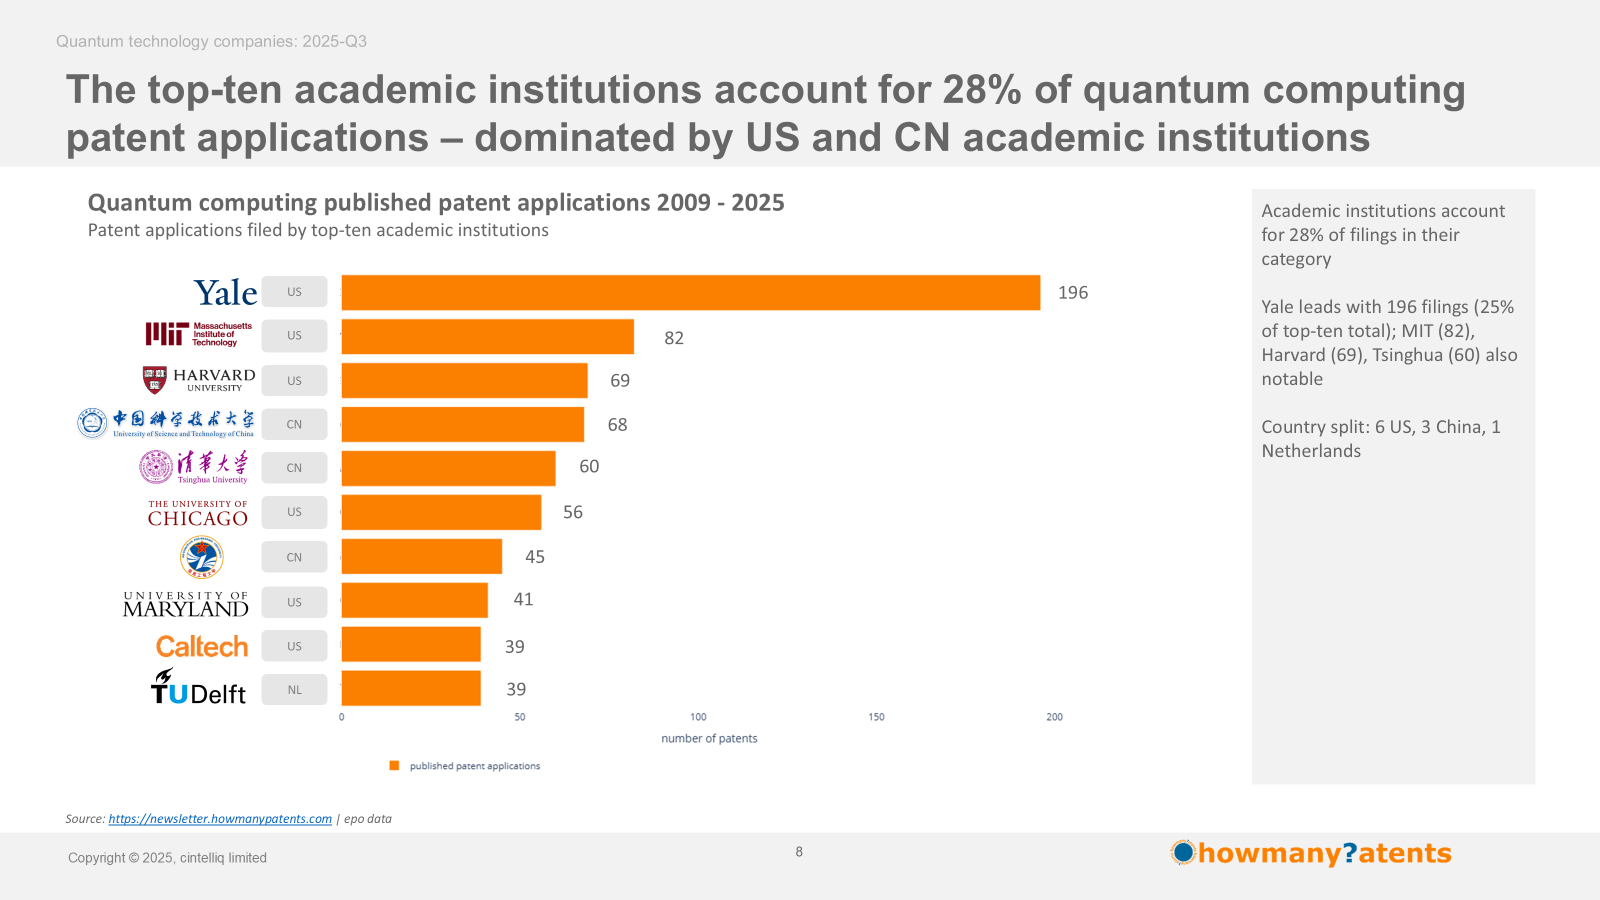
Top-ten academic institutions
The top-ten academic institutions account for 28% of quantum computing patent applications. Yale leads with 196 patent applications (25% of top-ten total). MIT follows with 82, Harvard with 69, and Tsinghua with 60.
By country, there are 6 US institutions, 3 Chinese institutions, and 1 Dutch institution.
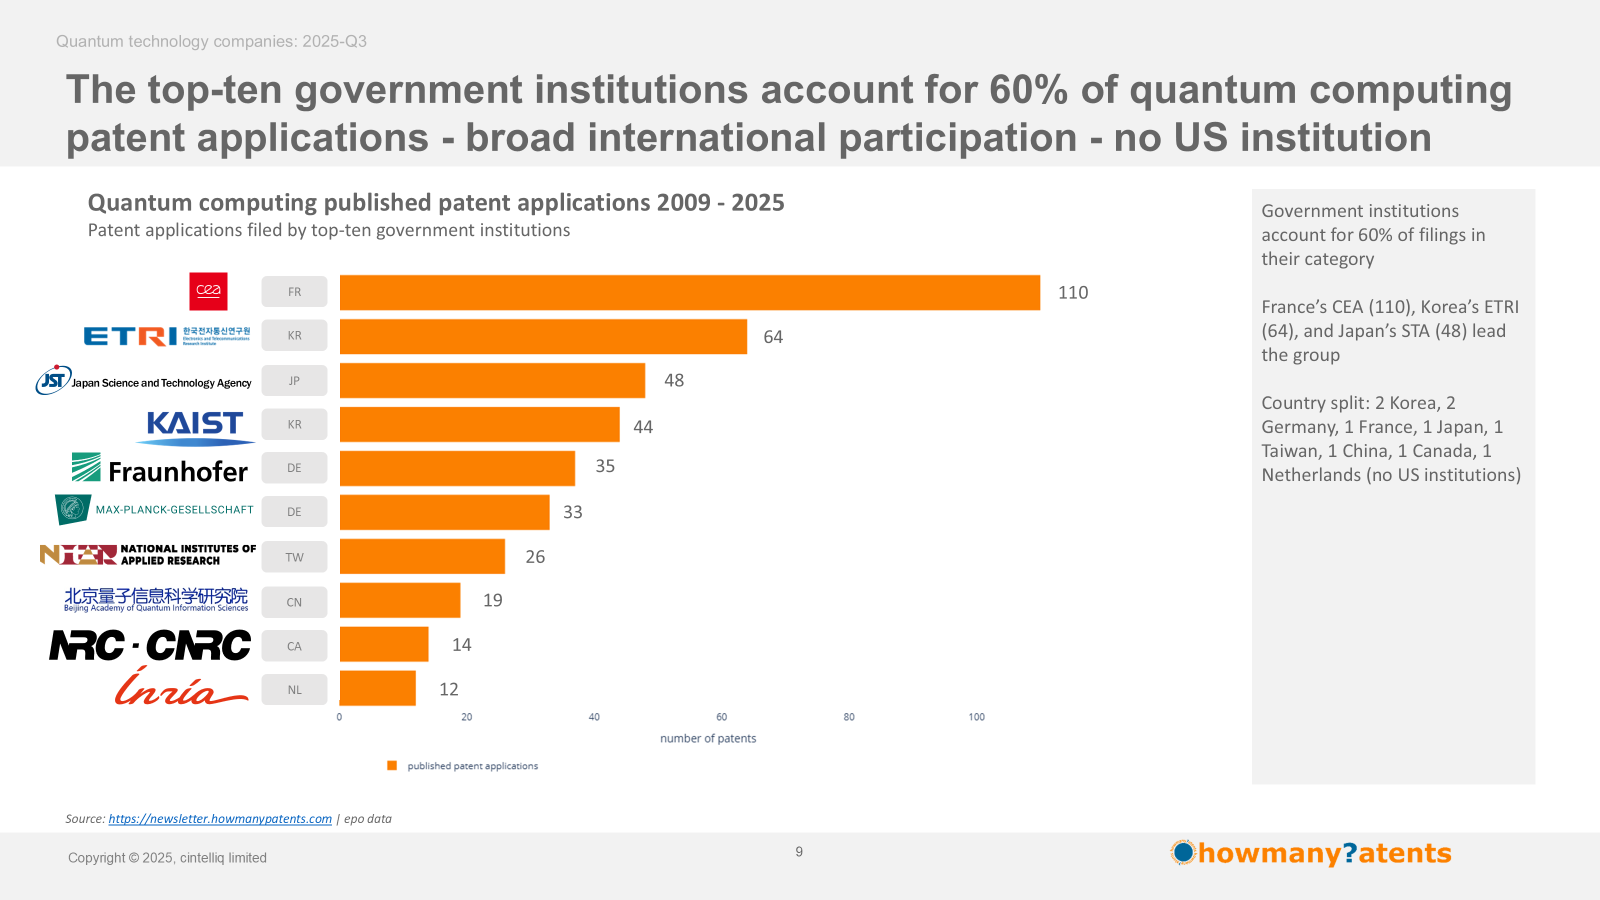
Top-ten government institutions
The top-ten government institutions account for 60% of quantum computing patent applications - broad international participation - no US institution.
The top-ten government institutions include France’s CEA (110), Korea’s ETRI (64), and Japan’s STA (48). While CEA leads, most government institutions have fewer patent applications compared to commercial organisations.
By country, there are 2 Korean, 2 Germany, 1 French, 1 Japanese, 1 Taiwanese, 1 Chinese, 1 Canadian, and 1 Dutch. There are no US government institutions in the top-ten.
Quantum computing patent landscape shows clear concentration of activity
The analysis shows that forty organisations account for 54% of published quantum computing patent applications between 2009 and 2025, highlighting a clear concentration of intellectual property activity across commercial companies, quantum-first companies, academic institutions, and government institutions.
IPC/CPC analysis will reveal technology segmentation
Patent counts alone do not establish technological dominance. Patent application volumes indicate where activity is occurring, but true strength depends on the specific sub-technologies — such as superconducting qubits, ion-trap systems, or photonics — where companies often hold very different positions.
Next insights
The next phase of this research will review IPC and CPC classifications to assess where organisations are investing within these sub-domains, and to identify which players are shaping the technological direction of quantum computing.