Quantum Technology Companies: patent analysis - part II
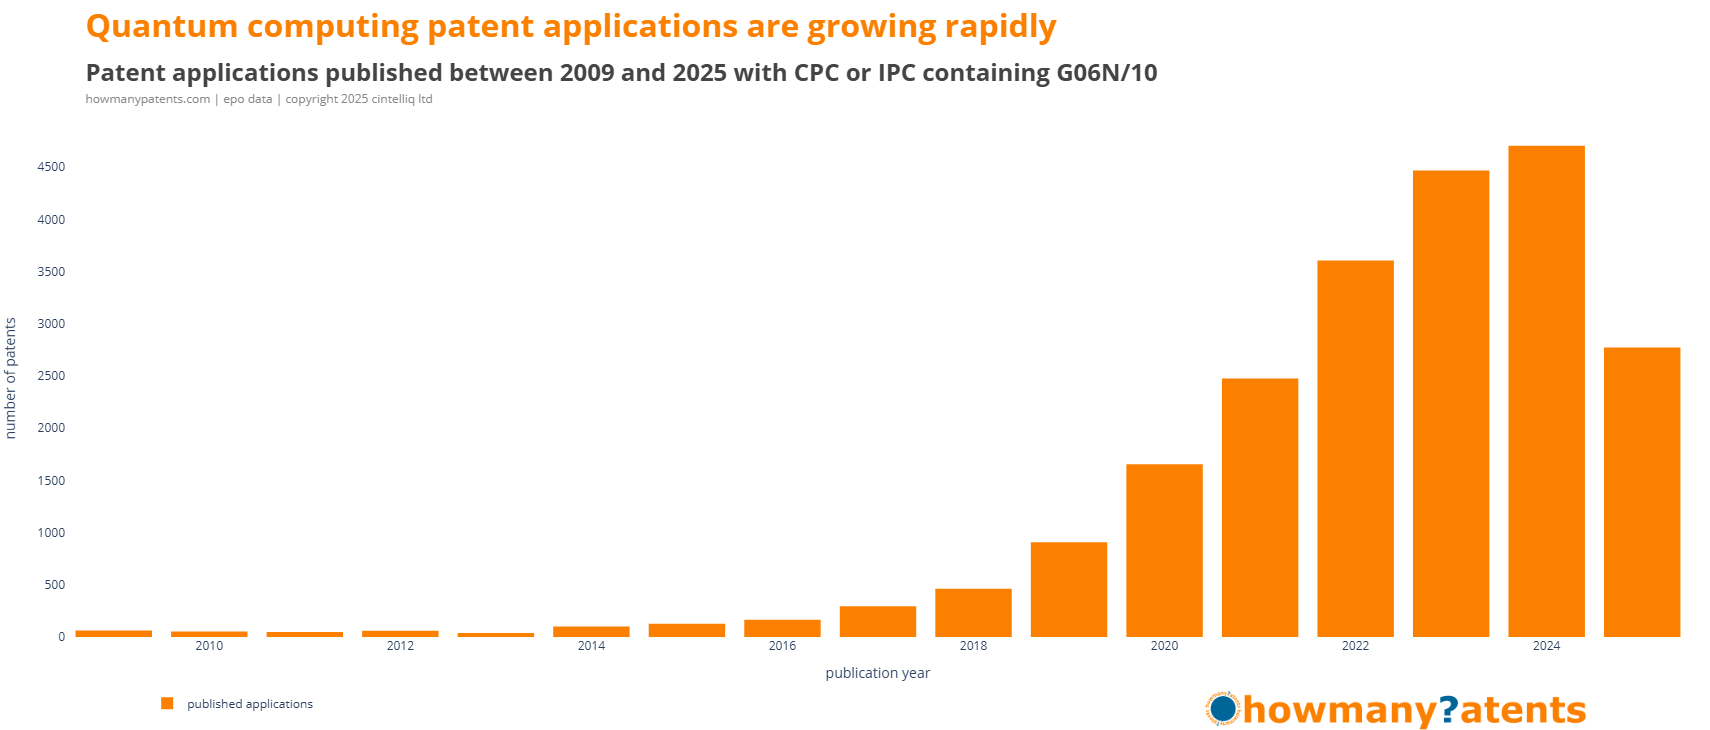
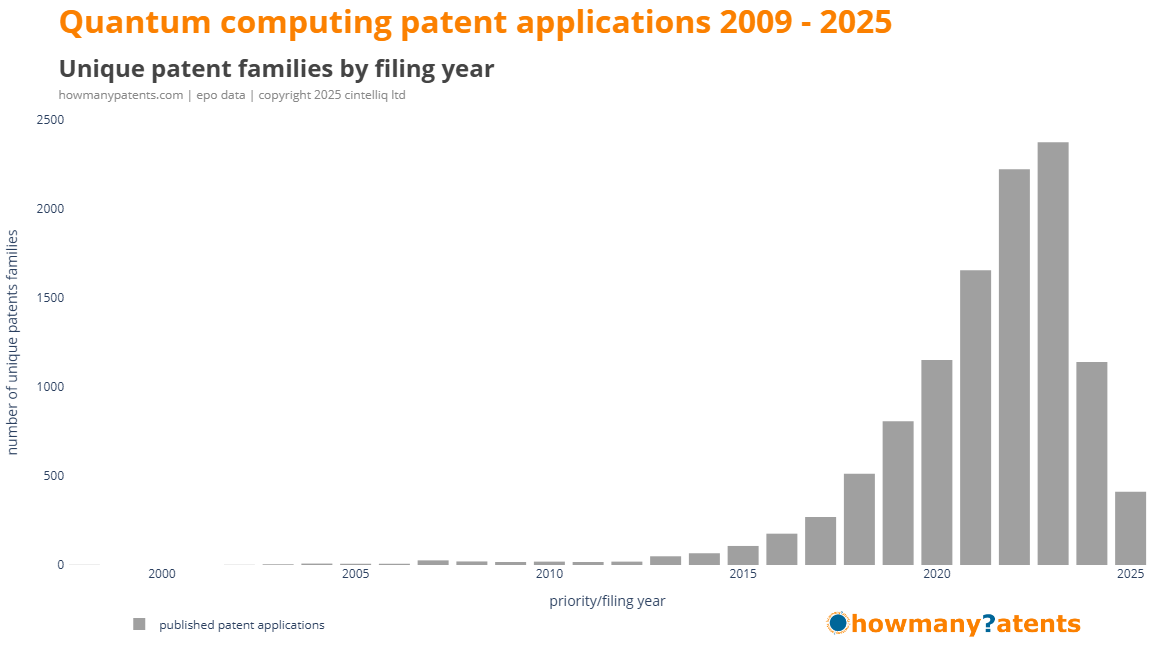
Background: Quantum computing patent applications have increased significantly since 2009, reflecting the growing maturity and industrial relevance of the field.
Patent intelligence for people who don't read patents
However, for those without a background in patents, or the means to access patent analytics, it’s not always clear what this growth in patents means for strategy, innovation, or competition.
To address this we are publishing the Quantum Technology Companies: Patent Report 2025. The report will be available at the end of September 2025.
The report aims to translates complex patent data into clear, decision-useful insights—designed for people who don’t read patents but need to understand what they reveal.
So whether you're tracking competitors, exploring partnerships, or planning R&D strategy, this report offers practical patent intelligence without legal jargon or technical complexity.
Sharing insights as we progress
As our research progresses towards the release of the report I’ll be sharing selected findings from the research conducted so far for the Quantum Technology Companies: Patent Report 2025.
Previously, we looked at the overall progress of quantum patent applications.
See previous article Quantum Technology Companies: patent analysis
This week's analysis
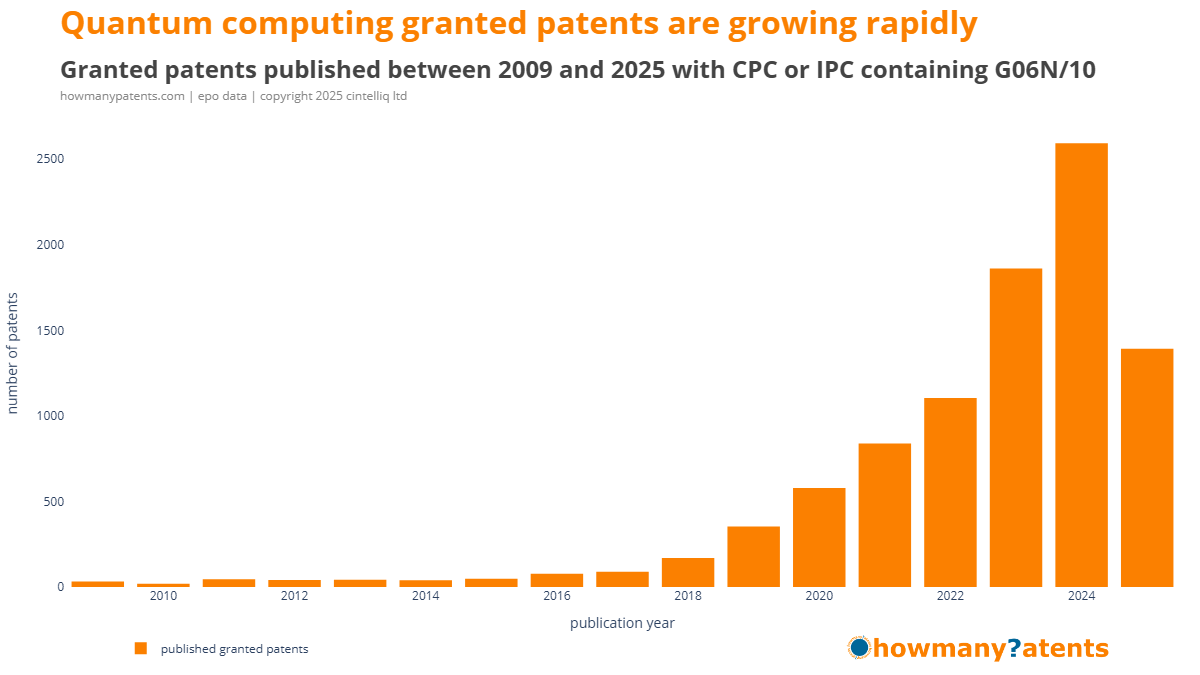
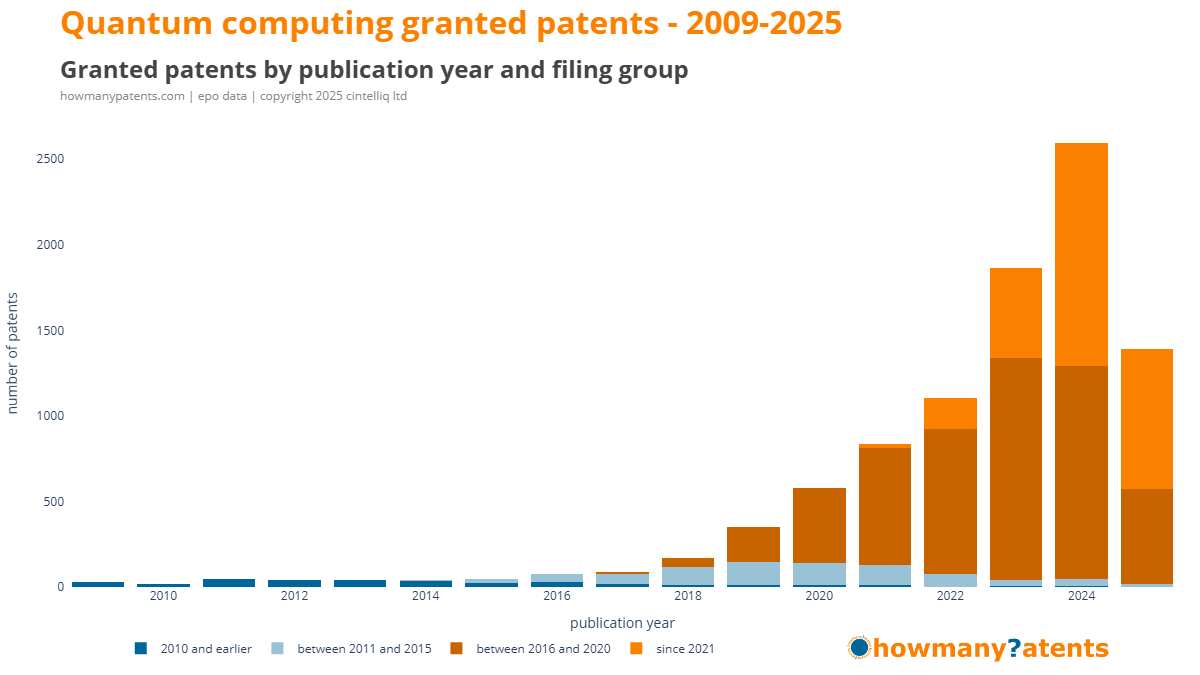
Granted patents by publication year
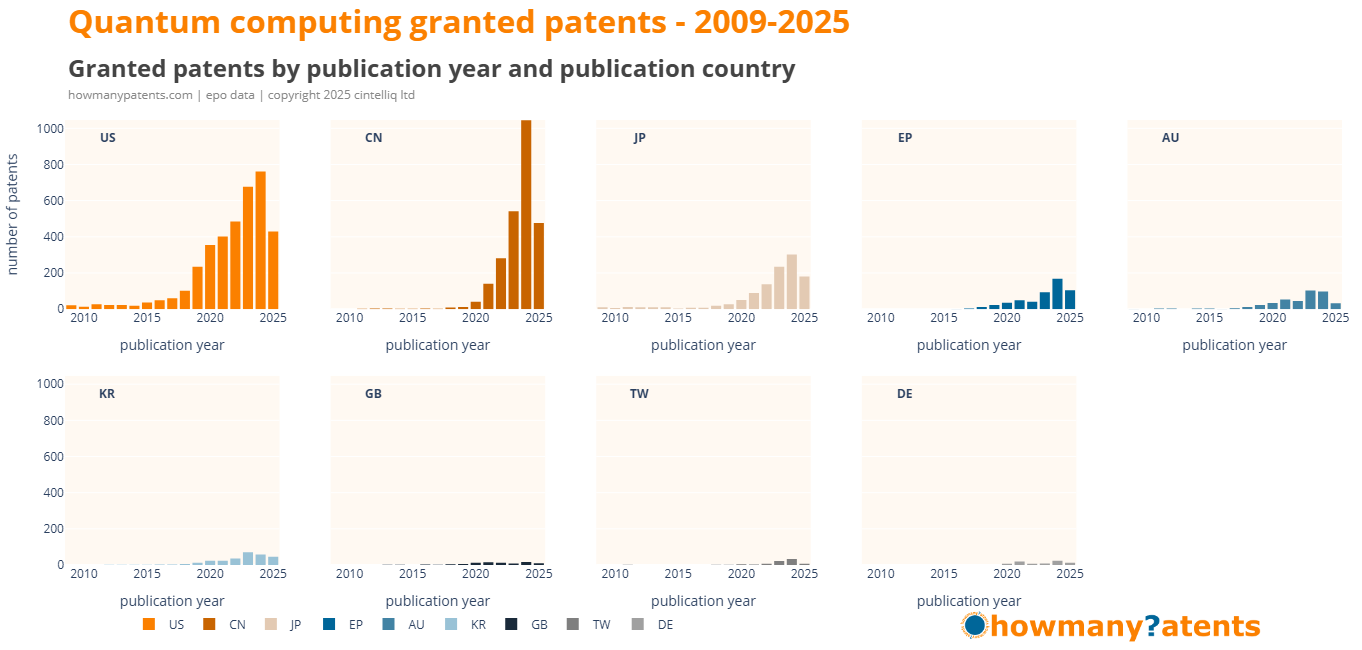
The chart below shows the number of granted patents published each year since 2009. Just like patent applications, there is a clear upward trend. This is to be expected as an emerging technology starts to commercialise.
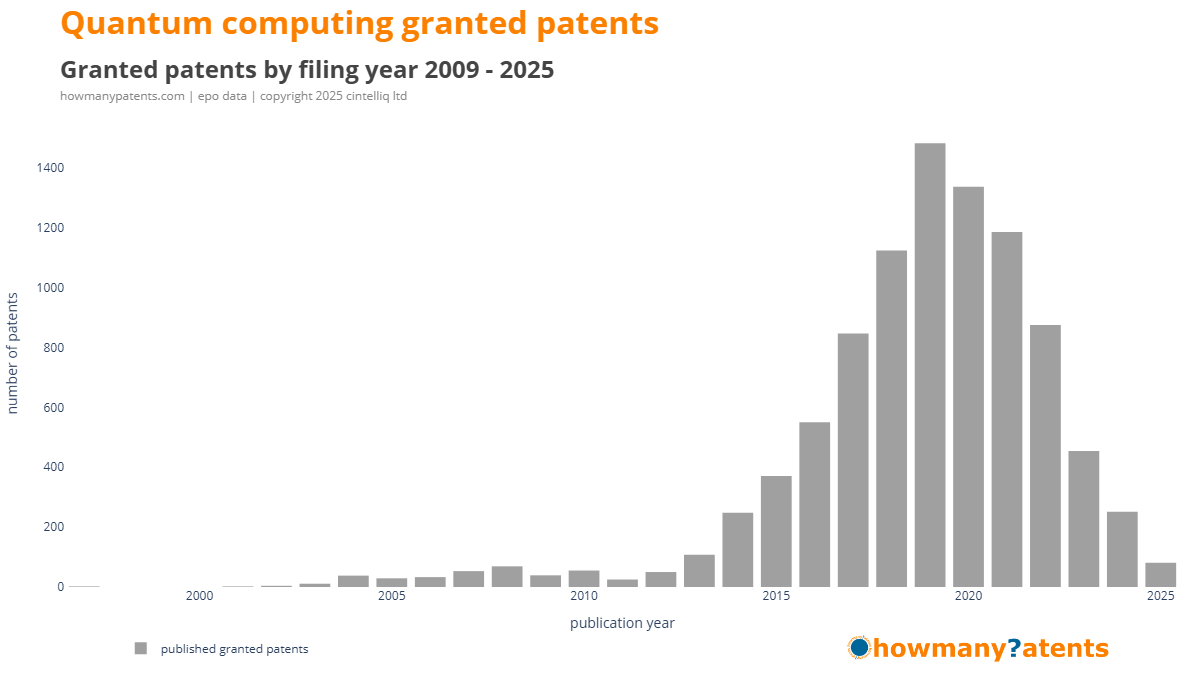
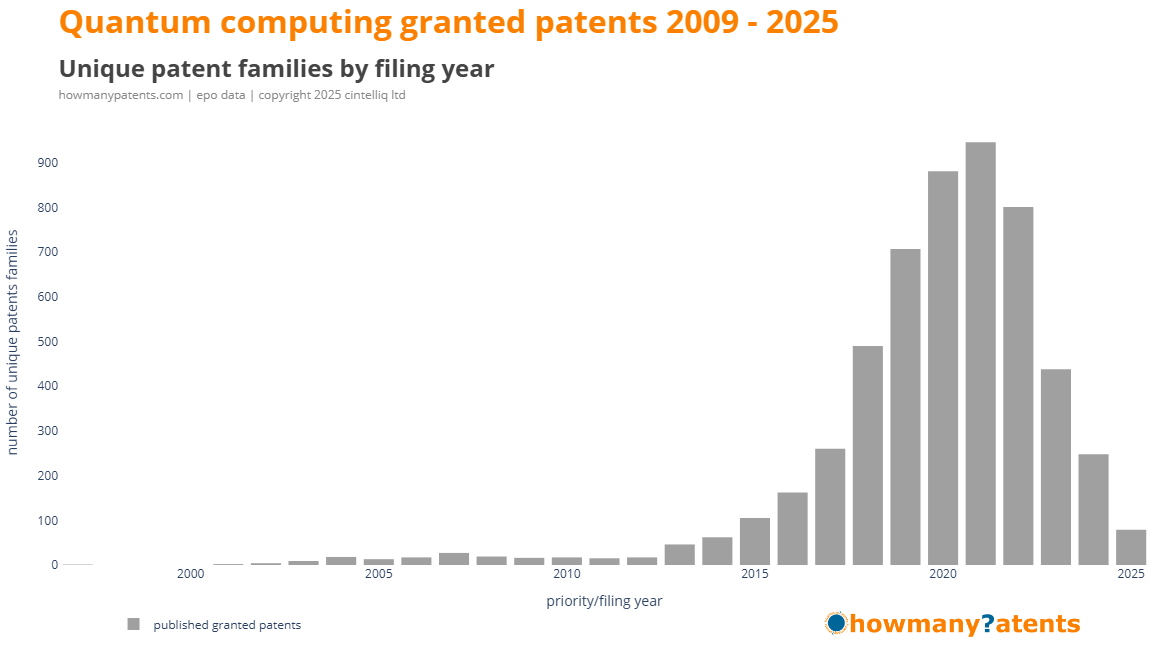
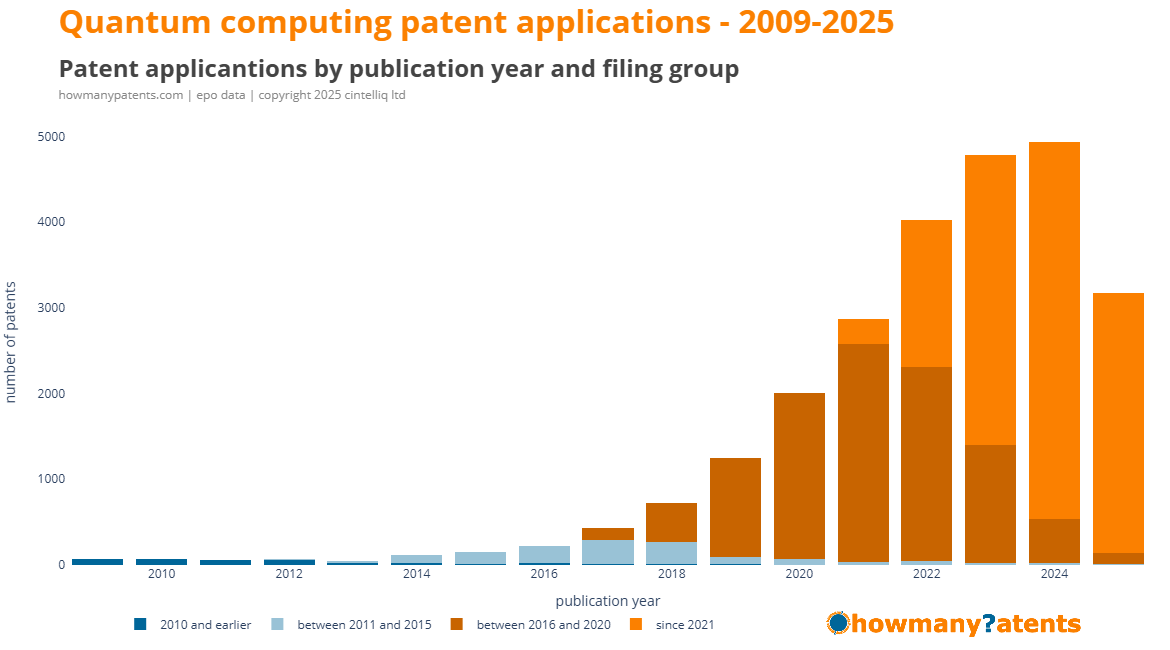
Granted patents by filing year
As we saw with patent applications another way to look at patents is in terms of the filing dates, in this case filing year. This gives a clearer view of when the invention was first claimed - and is often used as a way of dating the invention itself.
For granted patents we see there has been a majority filed before 2020,and more than 1,400 filed in 2019.
To help with analysis, I’ve colour-coded the filing dates in four groups: before 2009, 2010–2015, 2016–2020, and 2021 onwards.
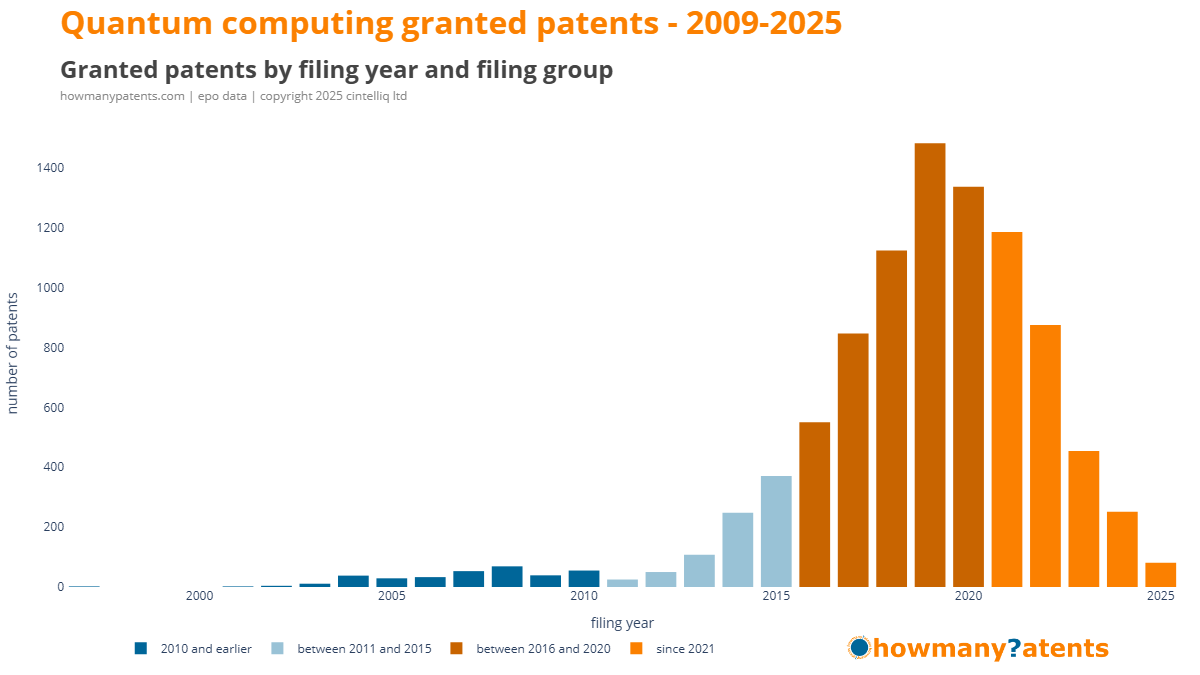
Colour-coding the granted patents by filing year becomes more useful when combined with publication year. Plotting them this way shows how many granted patents were published each year, grouped by when they were actually filed.
This highlights an important point: a granted patent published this year might relate to an invention filed — and originally developed — several years earlier.
You can see this clearly in the group of granted patents filed between 2016 and 2020. Many of them were still being published as late as 2025, even though the peak filing year year was 2019.
Time to grant
The time from a patent application filing to a granted patent is shown in the chart below. The average time-to-grant is around 36 months, it has slowly been edging higher since 2019 were the average time-to-grant was 30 months.
Clearly, these are averages and can be misleading: some patents are granted quickly, while others take much longer. It often depends on how well the patent application is written, how focused the claims are, and how smoothly the back-and-forth between the company and the patent office goes.
In other words, 36-months is a useful benchmark — but will vary on a case-by-case basis.
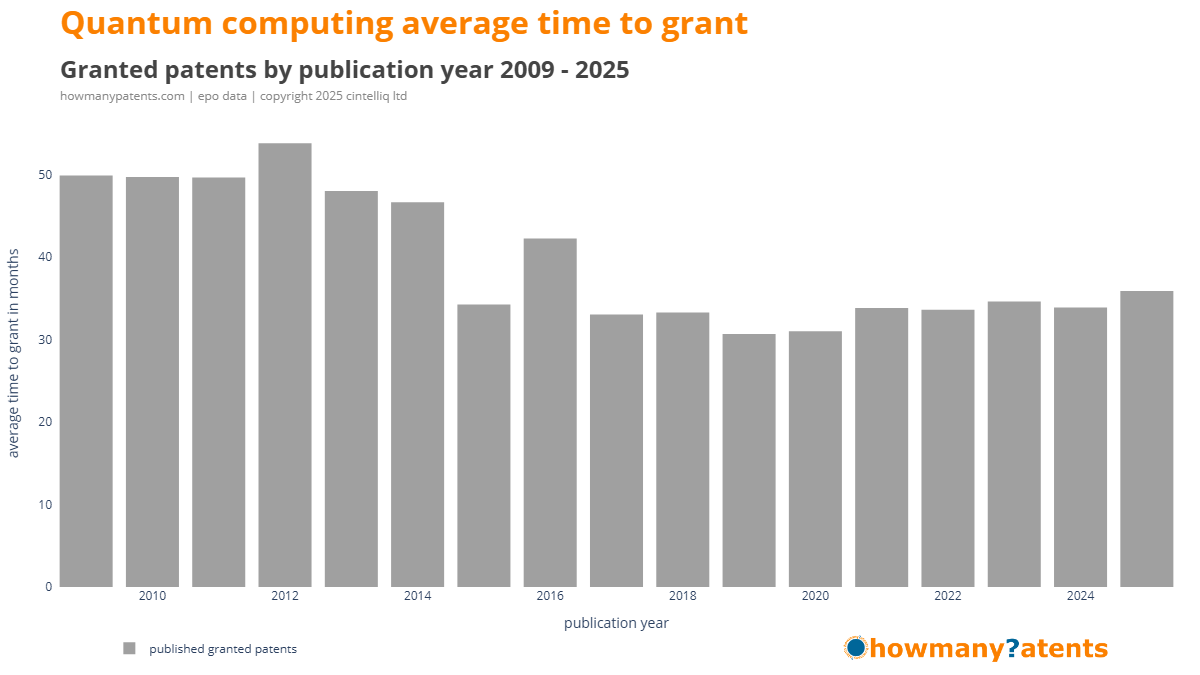
Why is time-to-grant helpful?
If a patent application takes longer than the 36-month average may suggest the application is facing challenges (e.g. difficult claims or specification), is under opposition, or may even be heading toward abandonment. So worth monitoring.
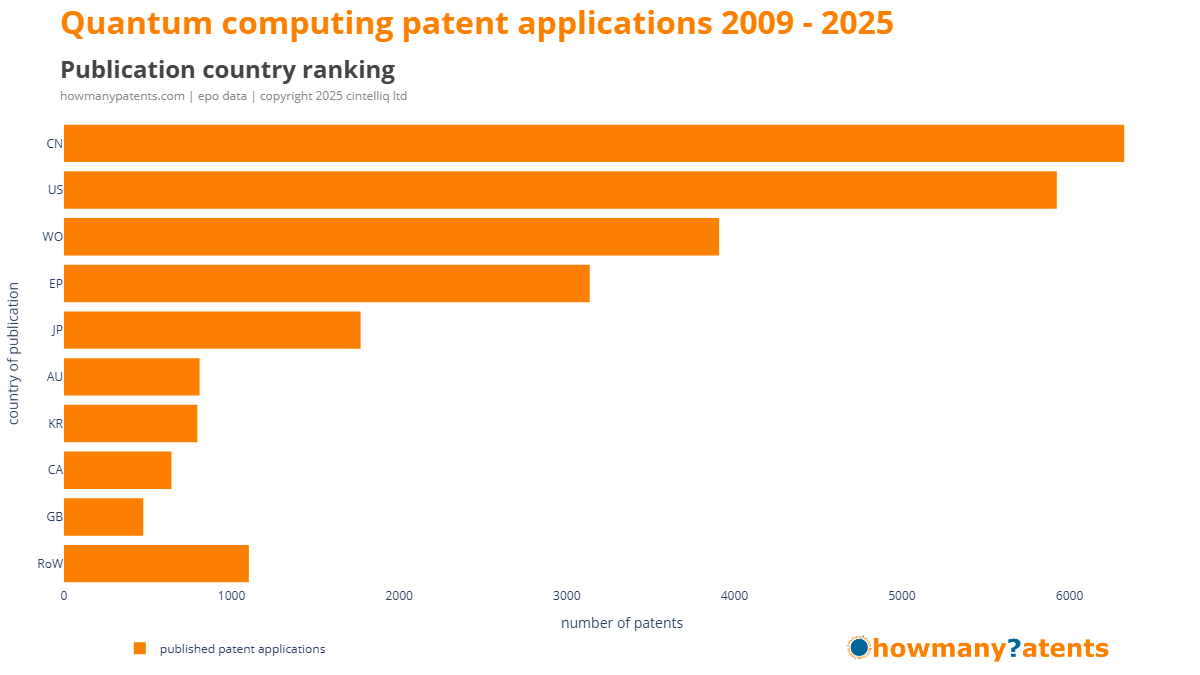
Publication country
Companies file patent applications with patent offices around the world mainly to support how and where they plan to commercialise their inventions. Because patents are only valid in the country (or region) where they are granted, businesses often need to file in several jurisdictions to ensure a smoother path for commercialisation and to reduce the risk of competitors copying their ideas in those markets.
In the tables, two-letter codes are used for countries, and RoW is included to mean “Rest of the World,” grouping all other countries together.
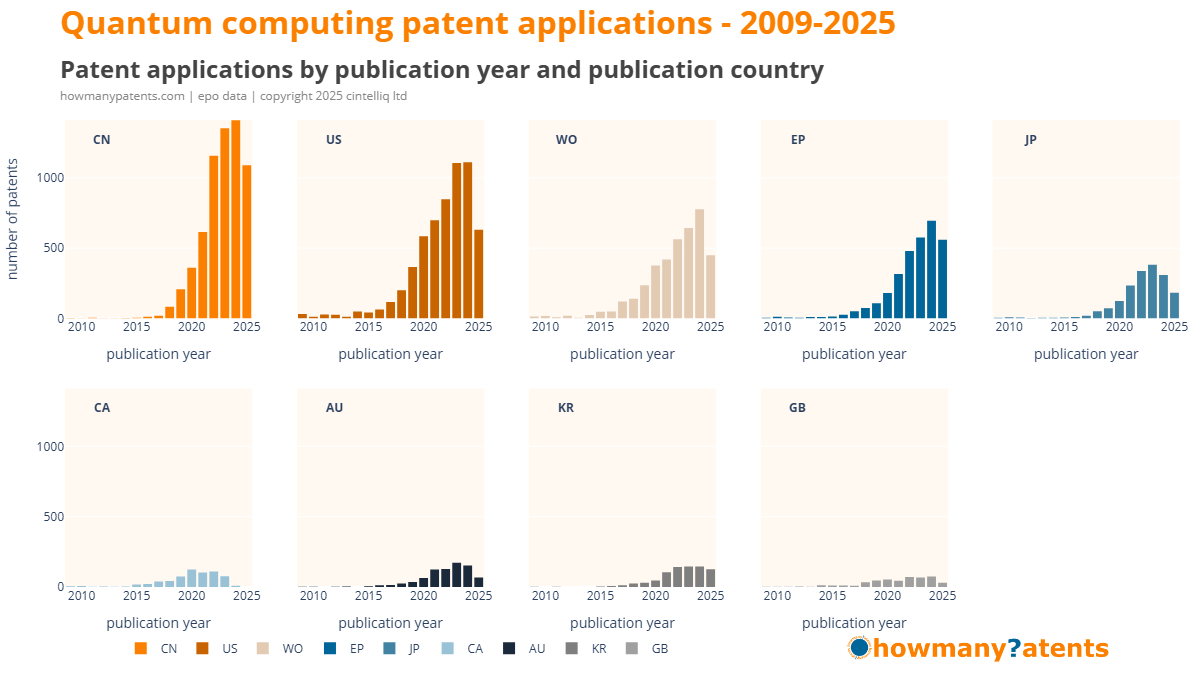
Patent applications
The top four countries - China, the USA, Europe and Japan - account for 85% of quantum computing patent applications filed. I have not included WO (WIPO) applications here, as they do not result in patents themselves.
Companies file with WIPO under the PCT to keep their global options open. One filing secures an international date and gives them up to 30 months to decide which countries to pursue, delaying big costs while providing early patentability feedback.
A WIPO filing is simply a placeholder to secure a priority date that is recognised worldwide, and companies still need to file patent applications in each country where they want protection.
What a WO application does provide is a visible signal to competitors of a company’s future patenting intentions, even though it carries no enforceable rights on its own.
Growth in publications at all the main PTO are growing rapidly.
Granted patents
The top four countries - the USA, China, Japan and Europe - account for 87% of quantum computing granted patents. There are no WO (WIPO) granted patents.
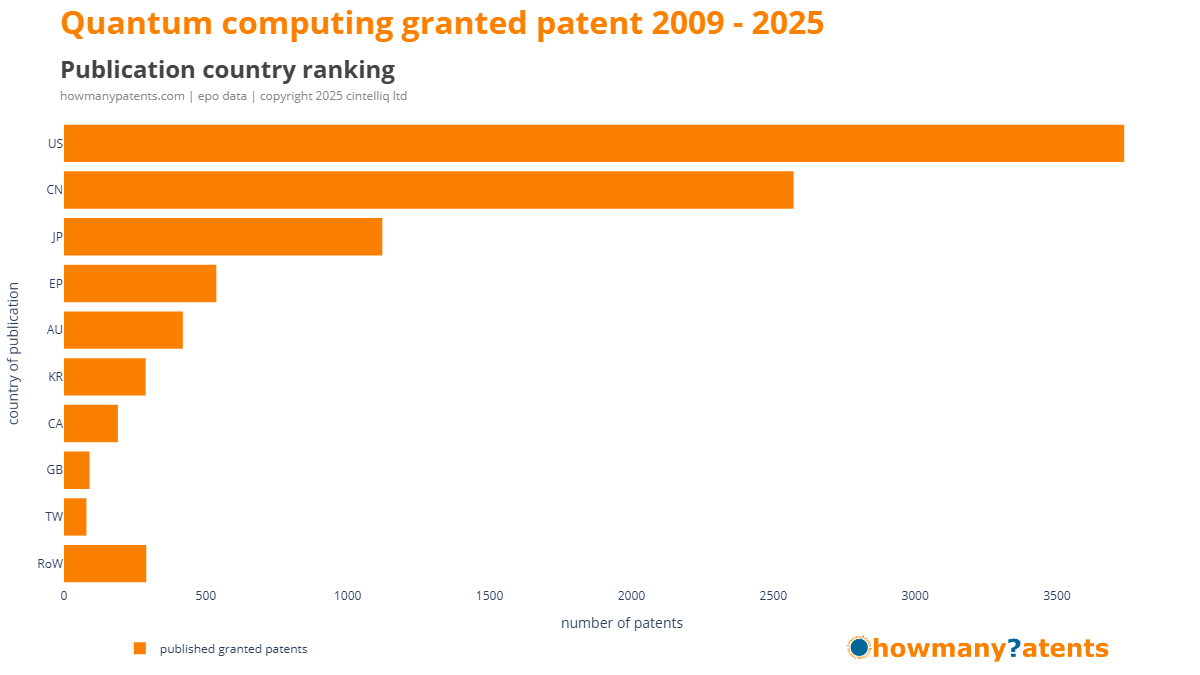
The main PTOs have the most granted patents, with both US and CN holding dominant positions.
Looking at patent activity by PTO shows where companies expect commercialisation to take place. But it does not reveal which countries are actually behind the filings and grants. For that, patents need to be analysed by their priority country.
Priority county
Analysing by priority country shows where patents are first filed, and reflects where the companies behind those applications are based.
Patent applications
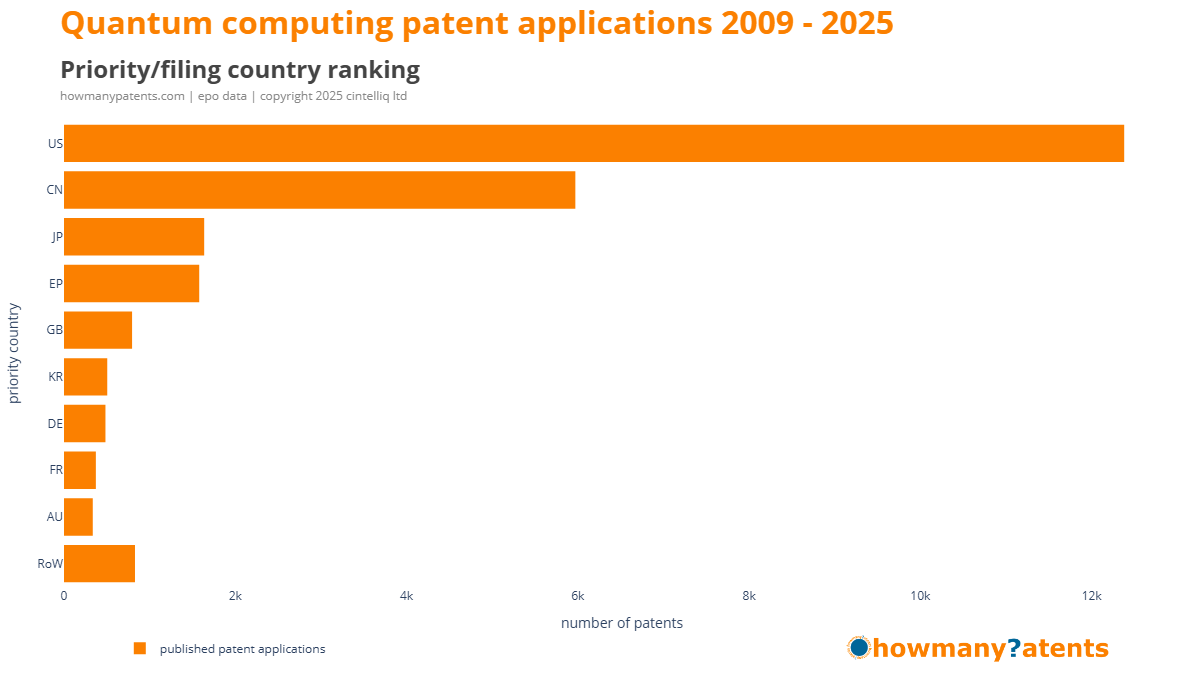
The chart below shows that, by priority country, filings are dominated by the US, which accounts for 50% of all applications. China contributes 24%, Japan 7%, and Europe 7%. This suggests technology development is currently centred in the US.

Granted patents
As expected, granted patents are awarded in very similar percentages: US (57%), China (26%), Japan (6%) and Europe (3%).
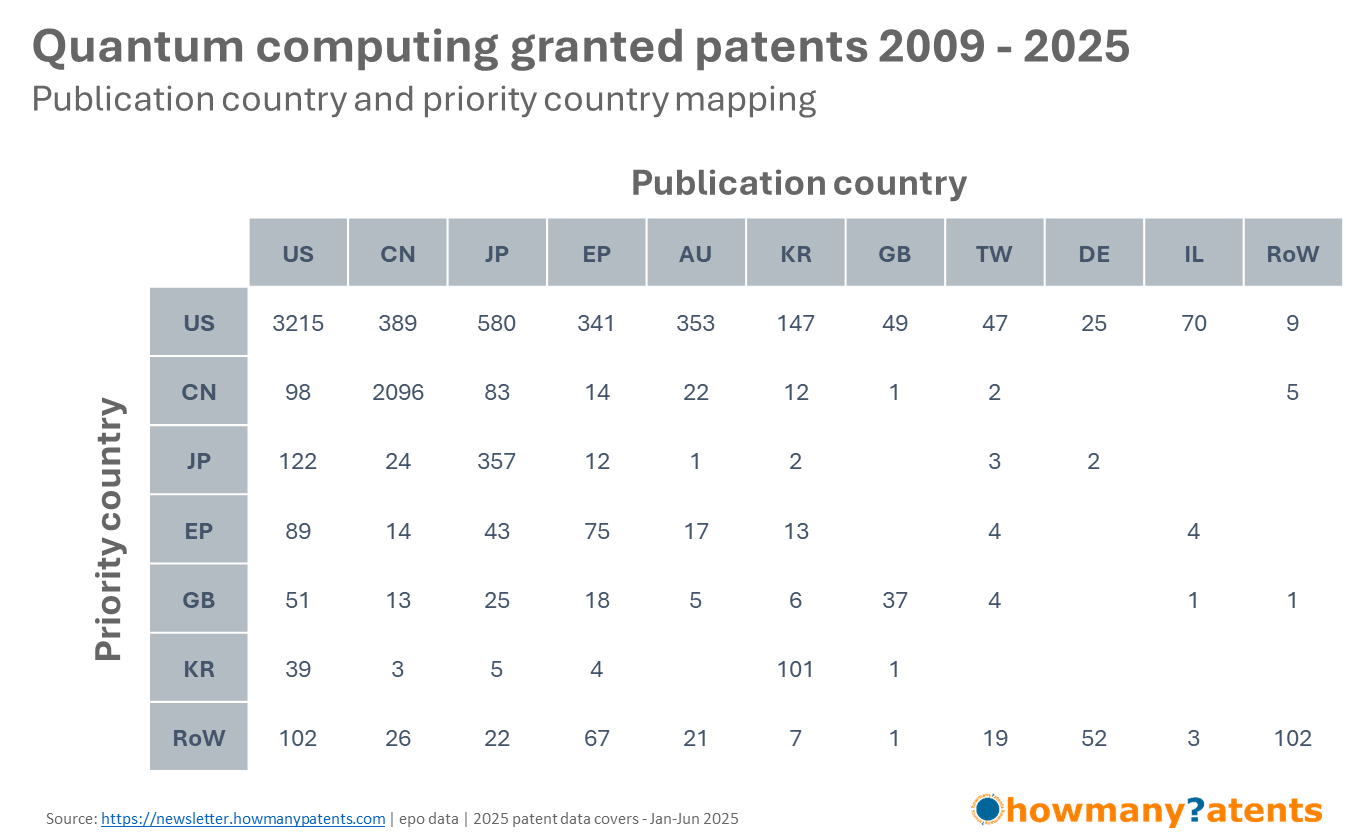
Publication country vs priority country mapping
Comparing publication country with priority country shows which patents stay at home and which are filed abroad.
Patent applications
The table below shows that most patents are published in the same country where they were first filed. US filings are mainly published in the US (4,417), and Chinese filings stay almost entirely in China (4,889). Japan and Europe also show a strong home focus.
The difference is in how much filing takes place outside the home country. US companies file more widely abroad, often through the WO route (2,384), and with strong activity in Europe (1,666) and China (970). Japan and Europe also file overseas, though at lower levels. Chinese companies, on the other hand, file mainly at home with very limited international activity.
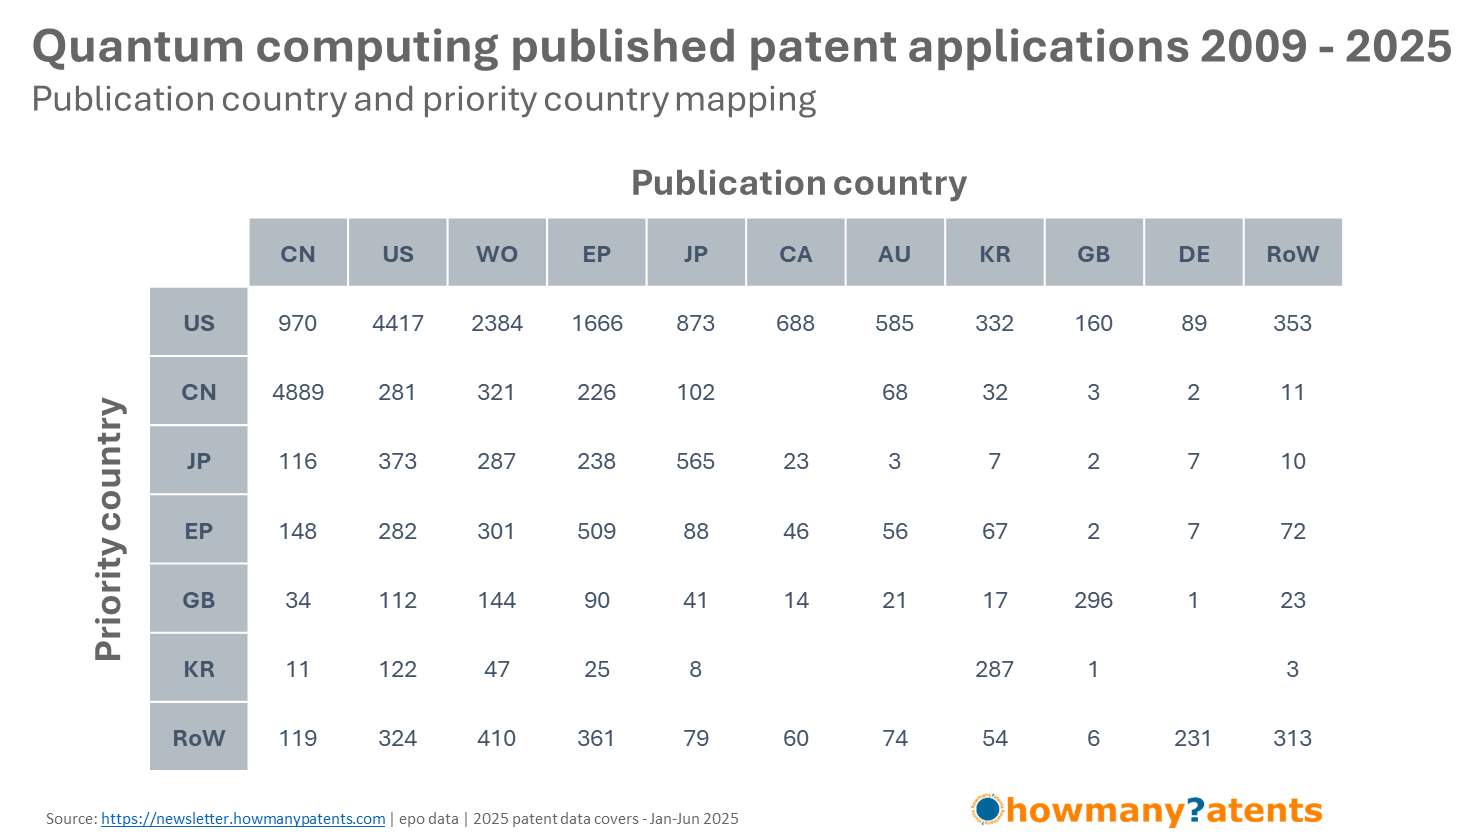
Note: Think of publication country as where you want protection, and priority country as country of origin.
Granted patents
The table below shows that most granted patents are published in the same country where they were first filed. US filings are mainly granted in the US (3,215), and Chinese granted patents almost entirely in China (2,096). Japan and Korea also show a strong home focus.
Note
- When a patent shows EP as the priority country, it means the first filing was made directly at the European Patent Office (EPO), rather than at a national office such as DE, FR or US. This is permitted under the Paris Convention.
- If the first filing is in a national office, that country is listed as the priority country. If the first filing is at the EPO, then EP is shown as the priority country. This does not hide the true origin — it simply records that the EPO was the very first filing office.
- Most cases with EP as priority come from European applicants, who choose the EPO first to obtain an immediate, high-quality search and to keep their options open for later filings in many countries.
Patent families
Patent families in simple terms represent a collection of patent applications and granted patents that all derive from a single invention.
Patent families are considered to be a more pragmatic approach to understanding the innovation of a company.
A company may have many patent applications across a number of different countries, but may only represent a simple patent family.
Comparing companies in terms of the number of patent families and the priority dates gives a more representative view of their innovation pipeline.
Patent family - EPO definition
For the sake of clarity our analysis uses the concept of a "simple" patent family.
- Simple family: A simple family — often referred to as the DOCDBC family — is a group of patent documents that all stem directly from a single priority filing, representing the same invention in a straightforward, non-complex lineage.
- Extended family: An extended patent family — often referred to as the INPADOC family — is a grouping that includes all patents connected through a chain of priority claims, even if they don’t share the exact same initial priority filing, providing a broader view of related inventions.
EPO definitions
Patent applications
Analysis shows there are about 11,092 unique patent families representing nearly 25,000 patent applications, or roughly 2.27 applications per family (227 applications per 100 families). Of these, 6,819 families contain only a single application, while around 2,200 families have two or more. Families with multiple applications include both filings spread across different countries and, in some cases, multiple applications within the same country.
Granted patents
Analysis shows there are about 5,300 unique patent families representing nearly 9,000 granted patents, or around 1.69 granted patents per family (169 granted patents per 100 families). Of these, 3,842 families contain only a single granted patent, while about 1,500 families have two or more. Families with multiple granted patents include both grants spread across different countries and, in some cases, multiple grants within the same country.
Let's take a look at these for a single company
For this example I've chosen D-Wave for analysis. According to the company's website D-Wave was founded in 1999, and consider themselves as a leader in the development and delivery of quantum computing systems, software, and services. They also claim to be the world’s first commercial supplier of quantum computers.
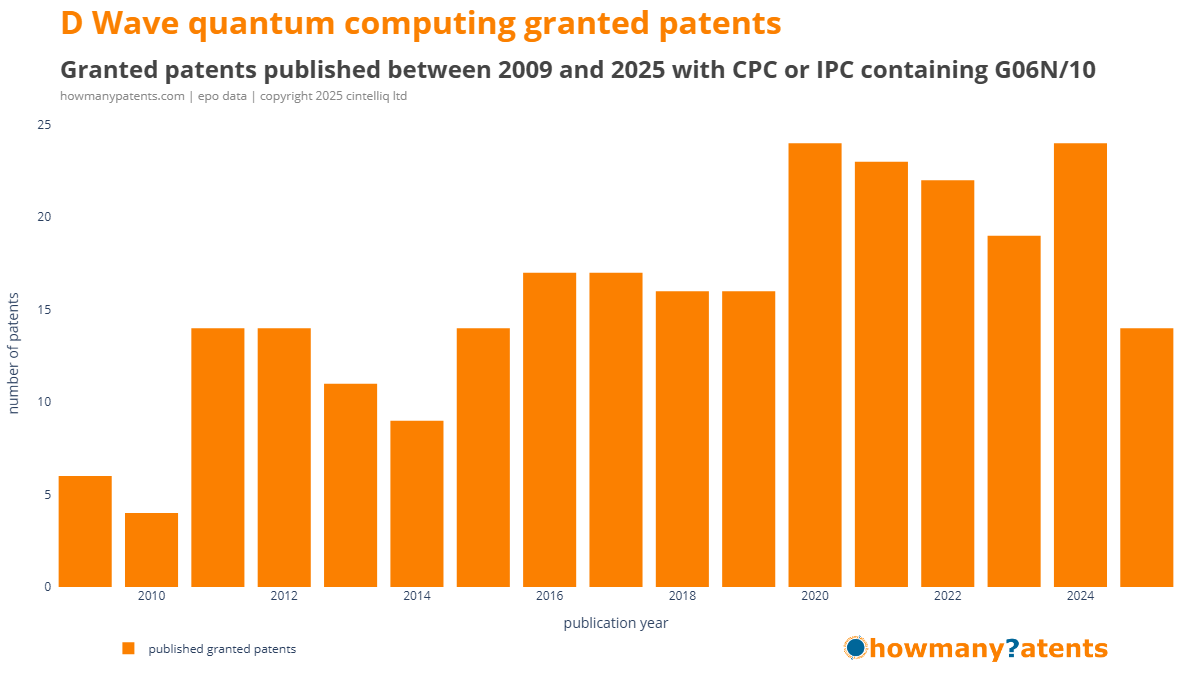
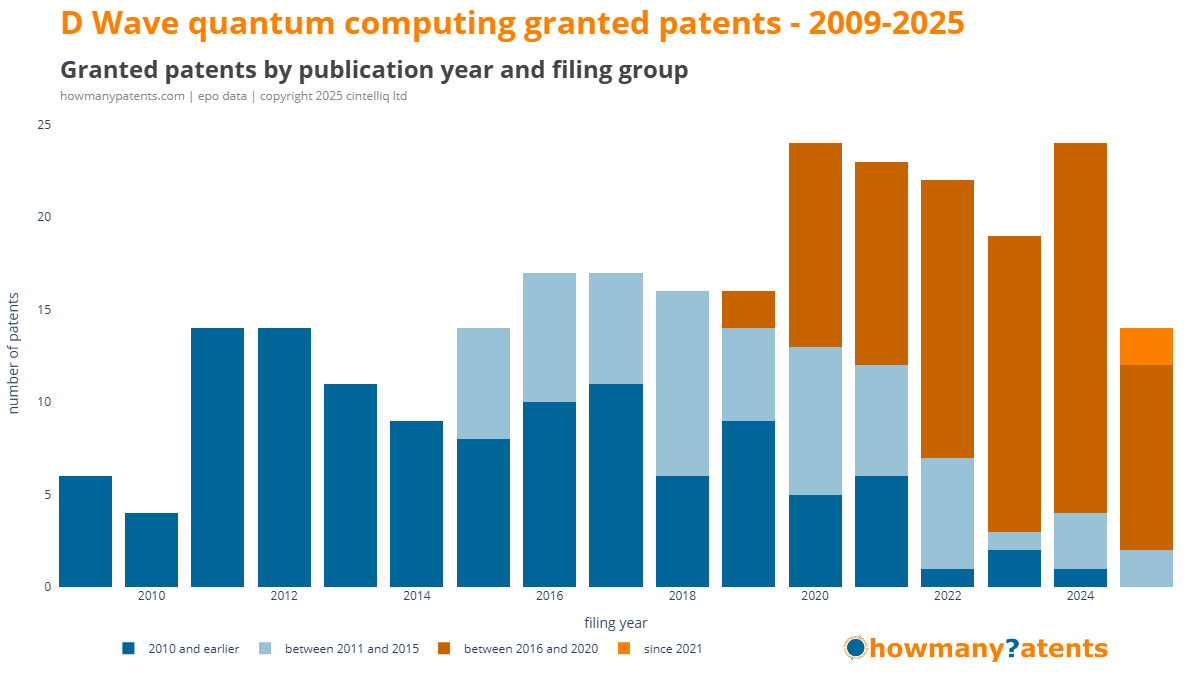
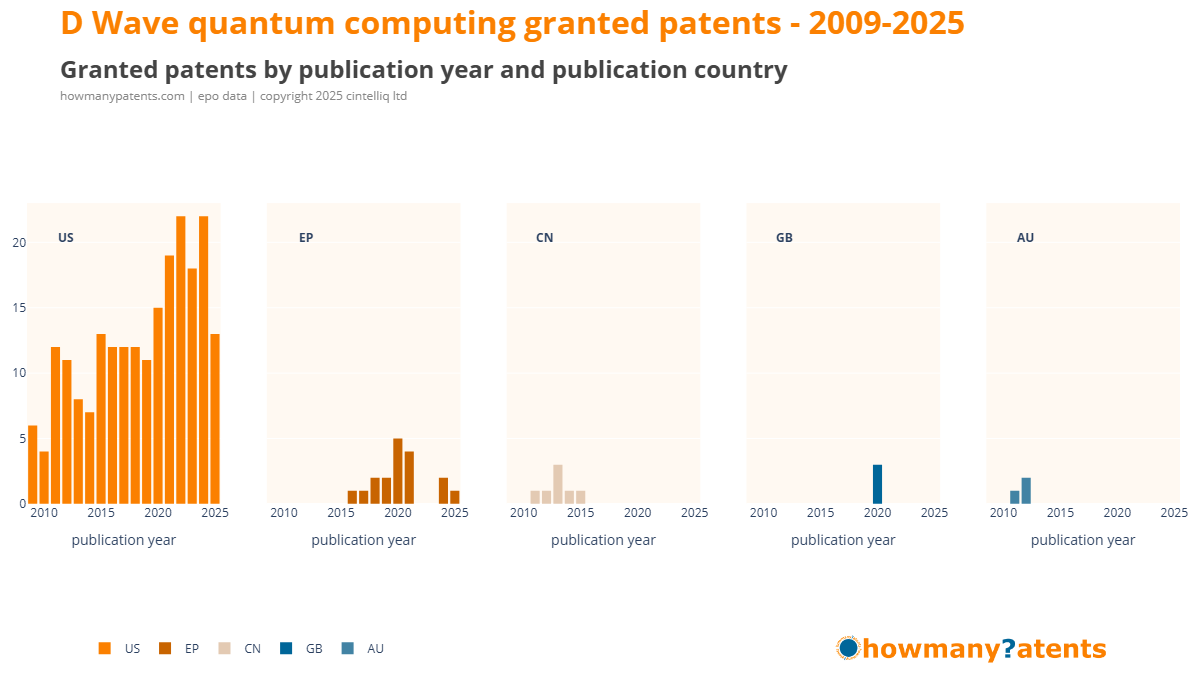
Granted patents by publication year
D-Wave has seen 245 granted patents published since 2009. Between 2020 and 2024, an average of 22 published granted patents. Between 2020 and 2025 saw 50% of all their granted patents published.
Granted patents by priority year
D-Wave's 245 granted patents are based on inventions filed in 2020 and earlier. Granted patents based on inventions filed since 2016 account for 34%, meaning 66% of the current published granted patents are based on inventions filed in 2015 or earlier.
Another observation to note is the number of granted patents being published may indicate a slowing down of their innovation pipeline, and possibly fewer patents being granted outside the USA.
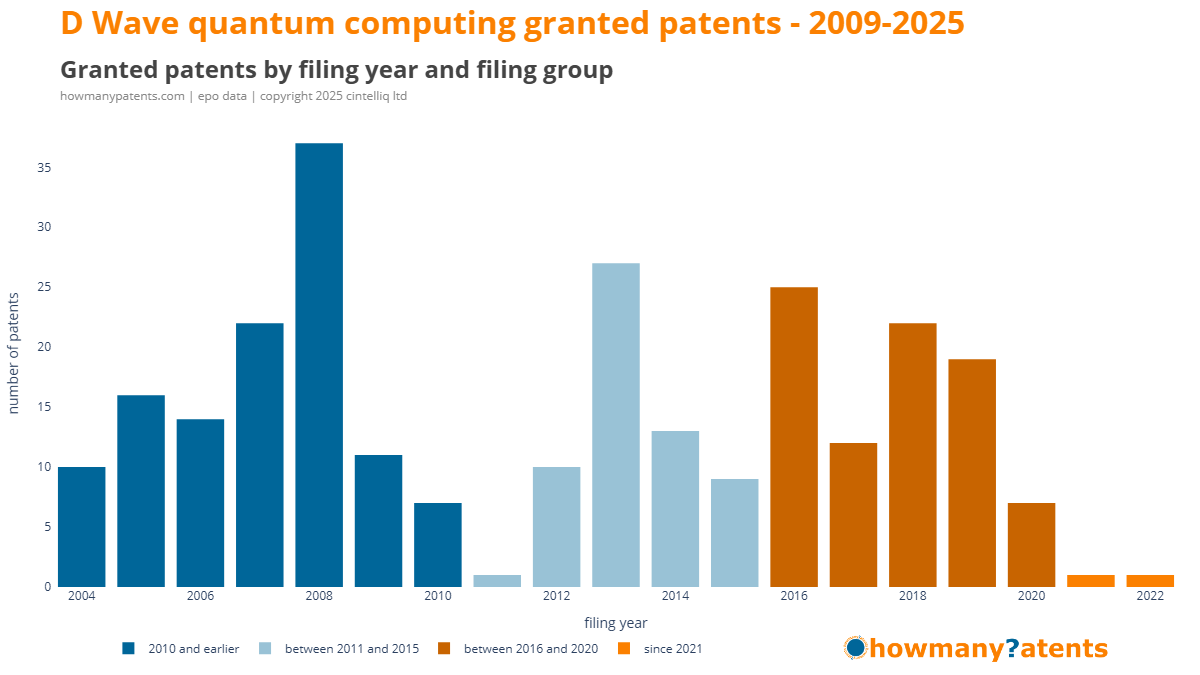
This highlights an important point: a patent published this year might relate to an invention filed — and originally developed — several years earlier.
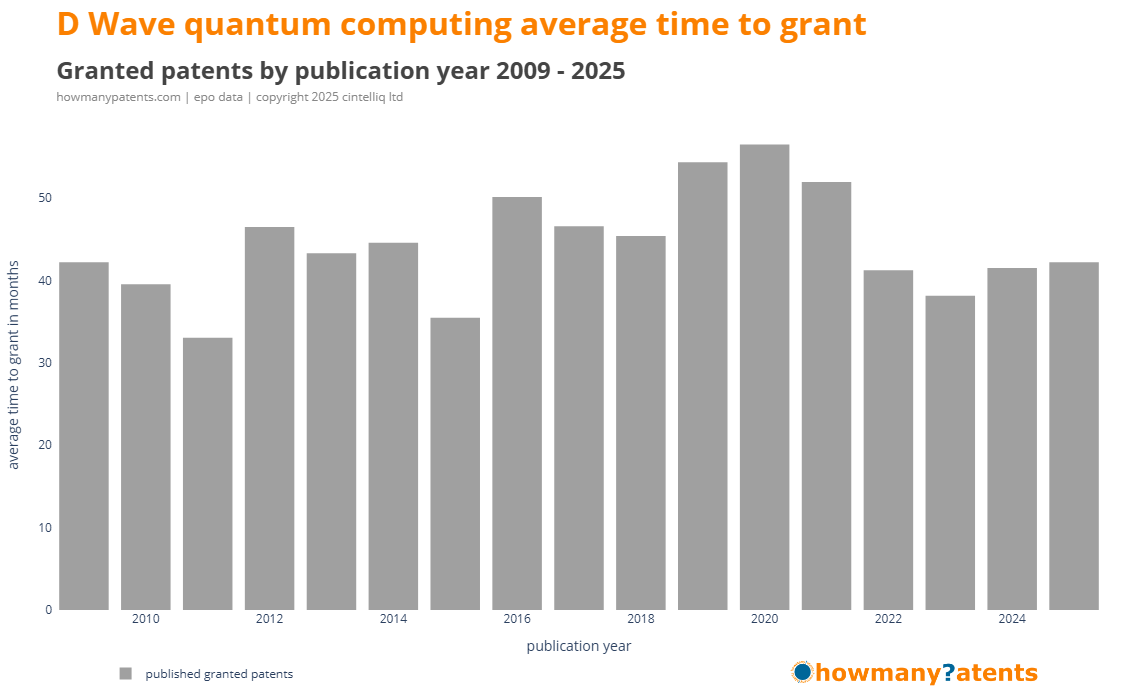
Time to grant
D-Wave’s average time-to-grant has generally been longer than the industry benchmark of 36 months, though it fluctuates year to year — sometimes coming in below, sometimes above.
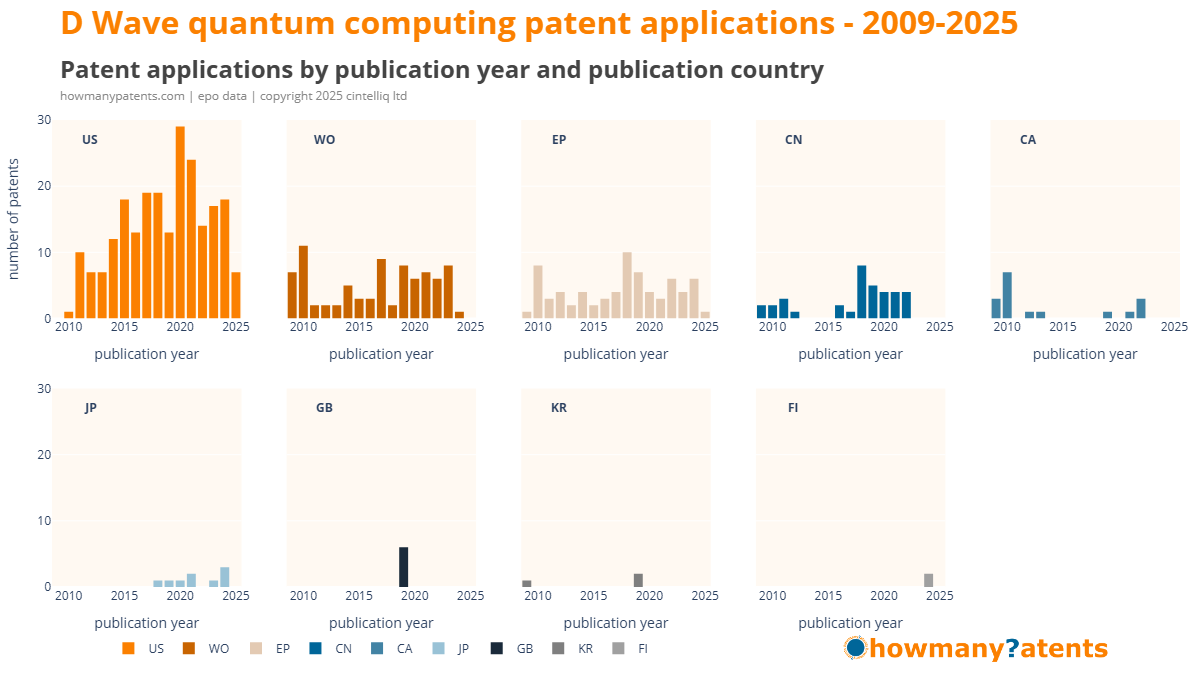
Publication country
D-Wave is a US-based company, so it is only to be expected that most of its patent applications have been filed with the USPTO.
Patent applications
D-Wave has actively filed patents in the US, EP, CN, CA, JP, GB, KR and FI. The majority are in the US.
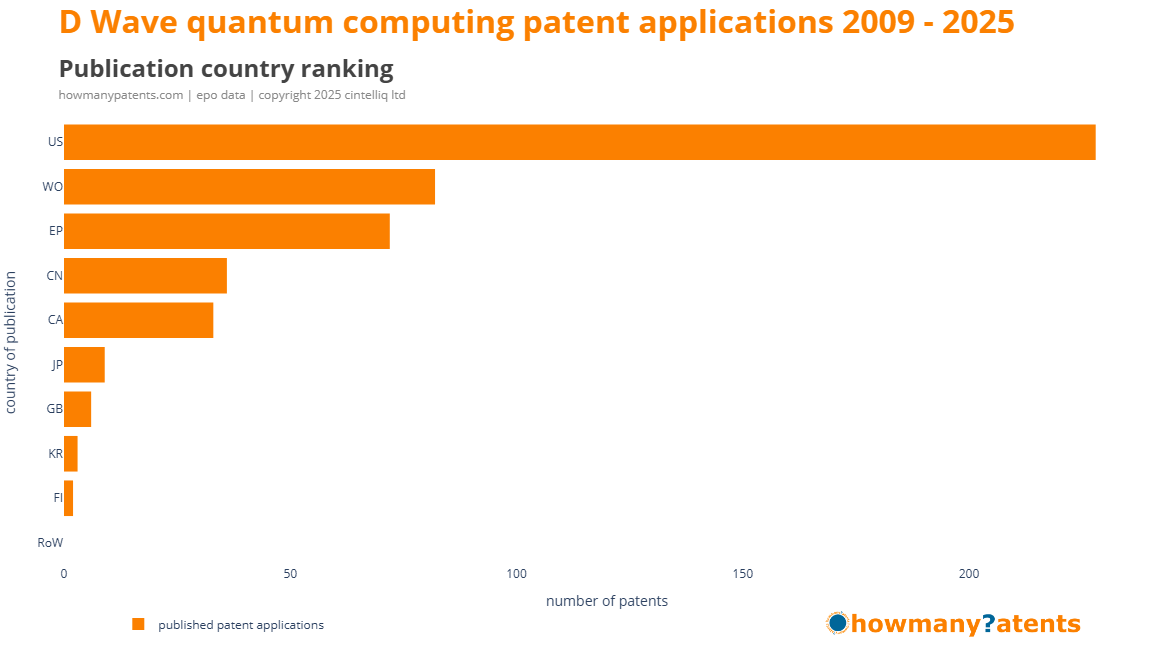
D-Wave’s patent applications are mainly US-based, with filings in other countries varying over time. Active international filing may be a signal that the company considers a particular innovation worth protecting worldwide — either for its own commercial use or to limit competition.
Granted patents
D-Wave’s portfolio includes over 200 granted US patents, with only a few granted elsewhere.
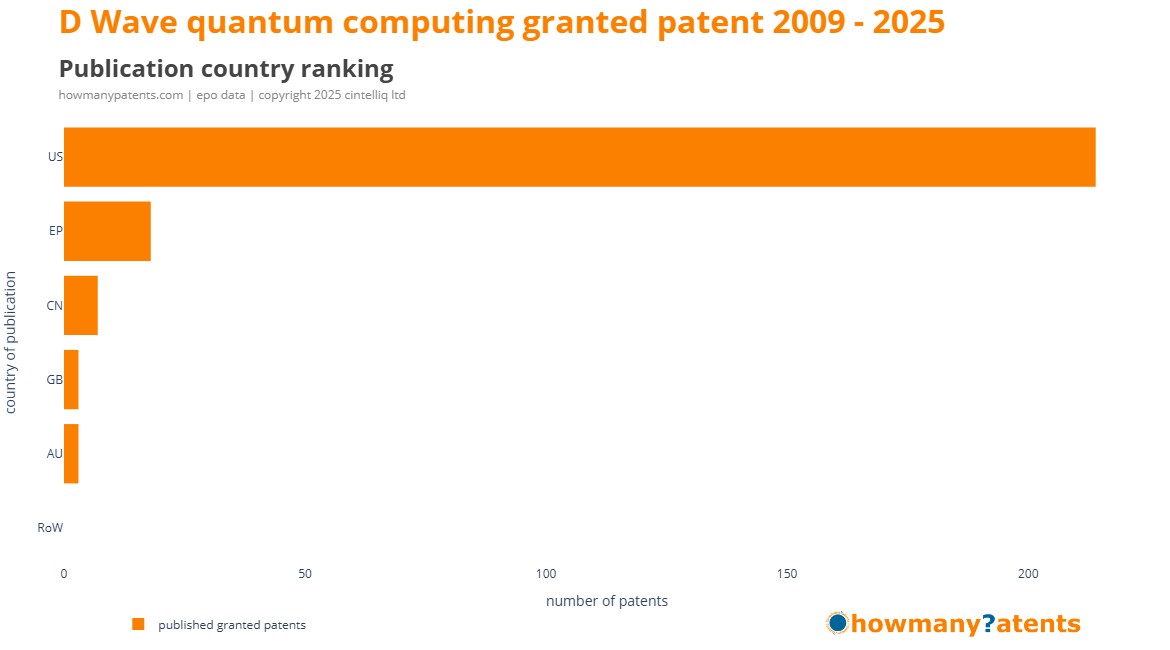
D-Wave’s granted patents are mainly US-based, with smaller numbers scattered across four other countries.
Next insights
We will look further at the patent dataset in terms of
- Applicants
Quantum Technology Companies: Patent Report 2025
Pre-order your copy today
The report will be available to purchase in late September 2025.
Pre-order, and pay, for the Quantum Technology Companies: Patent Report 2025.